Table of Contents
- Abstract
- TotalView Overview
- Preparing to Start and Starting TotalView
- TotalView's Basic Look and Feel
- TotalView's Basic Functions
- Continue to Part 2: Common Functions
- Jump to Part 3: Debugging
Abstract
TotalView is a sophisticated and powerful tool used for debugging and analyzing both serial and parallel programs. TotalView provides source level debugging for serial, parallel, multi-process, multi-threaded, accelerator/GPU and hybrid applications written in C/C++ and Fortran. Most HPC platforms and systems are supported. Both a graphical user interface and command line interface are provided. Advanced, dynamic memory debugging tools and the ability to perform "replay" debugging are two additional features. TotalView has been selected as the DOE ASC Program's debugger of choice for its HPC platforms.
This tutorial has three parts, each of which includes a lab exercise. Part 1 begins with an overview of TotalView and then provides detailed instructions on how to set up and use its basic functions. Part 2 continues by introducing a number of new functions and also providing a more in-depth look at some of the basic functions. Part 3 covers parallel debugging, including threads, MPI, OpenMP and hybrid programs. Part 3 concludes with a discussion on debugging in batch mode.
Level/Prerequisites: This tutorial is intended for those who are new to TotalView. A basic understanding of parallel programming in C or Fortran is required. The material covered in the following tutorials would also be beneficial for those who are unfamiliar with parallel programming in MPI, OpenMP and/or POSIX threads:
EC3505: MPI
EC3506: POSIX Threads
EC3507: OpenMP
TotalView Part 1: Overview
What Is TotalView?
- TotalView is a sophisticated software debugger product from Rogue Wave Software, Inc.
- ...and before that, TotalView Technologies, LLC (2007-2009)
- ...and before that, Etnus LLC. (1998-2007)
- ...and before that, Dolphin Interconnect Solutions, Inc. (1996-1998)
- ...and before that, BBN Systems and Technologies, a division of BBN Corporation (1993-1996)
- Used for debugging and analyzing both serial and parallel programs.
- Especially designed for use with complex, multi-process and/or multi-threaded applications.
- Without question, the most popular HPC debugger to date.
- Has been selected as the Department of Energy's Advanced Simulation and Computing (ASC) program's debugger.
Key Features of TotalView
- Designed to handle most types of HPC parallel coding
- Supported on most HPC platforms (in the US)
- Both a GUI and command line interface
- Can be used to debug programs, running processes, and core files
- Memory debugging features
- Graphical visualization of array data
- Comprehensive built-in help system
- Recording and replaying running programs
- Sessions Manager for managing and loading debugging sessions
Supported Platforms and Languages
- TotalView is supported on most major U.S. HPC platforms and Apple Mac OS X
- Ports of TotalView to other platforms (NEC, Hitachi, Fujitsu, etc.) are available from third-party sources.
- Supported languages/APIs include:
- C/C++
- Fortran77/90
- Assembler
- Multiprocess MPI
- Multithreaded OpenMP and Pthreads
- Intel Xeon Phi coprocessor
- NVIDIA GPU CUDA, OpenACC
- For the most up-to-date platform related information, see the TotalView Documentation on the Rogue Wave website: www.roguewave.com.
TotalView at LLNL
- Livermore Computing (LC) provides TotalView on all of its production platforms. All LC users have access to TotalView as part of their default path.
- LLNL employees who do not have an LC account can still install and use TotalView software on their local LLNL computers as part of a site-wide license agreement between LLNL and Rogue Wave Software. Details and a request form are available at: hpc.llnl.gov/software/development-environment-software/totalview-debugger/totalview-site-license-request.
Preparing to Start and Starting TotalView
Environment Setup
- Path Variable:
- Taken care of for LC users.
- TotalView should be in the default path of LC users.
- If you prefer a version different than the default, load the desired package:
module avail totalview
module load package-name
- License Manager File: taken care of for LC users
- Authorization: taken care of for LC users
- X11: here's one you have to do for yourself
- Because the TotalView GUI is an X11 application, you will need to make sure that your X11 forwarding environment is setup correctly. This may differ from machine to machine, depending upon such factors as:
- Your machine platform - Linux, Mac, Microsoft...
- The type of X11 server software you have installed
- SSH software and X-tunneling
- Connectivity method between your local machine and the machine where TotalView is running
- Network and access security
- Because the TotalView GUI is an X11 application, you will need to make sure that your X11 forwarding environment is setup correctly. This may differ from machine to machine, depending upon such factors as:
Compiling Your Program
- -g:
- Like many UNIX debuggers, you will need to compile your program with the appropriate flag to enable generation of symbolic debug information. For most compilers, the -g option is used for this.
- TotalView will allow you to debug executables which were not compiled with the -g option. However, only the assembler code can be viewed.
- Beyond -g:
- Don't compile your program with optimization flags while you are debugging it. Compiler optimizations can "rewrite" your program and produce machine code that doesn't necessarily match your source code.
- Parallel programs may require additional compiler flags
Starting TotalView
- TotalView can be started in several different ways, depending upon whether you want to:
- debug an executable file
- attach to a running process
- debug a core file
- recall a past debugging session
Some Examples
| Command / Action |
|---|
| totalview Starts the debugger with the Session Manager. You can then load a program, corefile, or attach to a running process. |
| totalview filename Starts the debugger and loads the program specified by filename. |
| totalview filename corefile Starts the debugger and loads the program specified by filename and its core file specified by corefile. |
| totalview filename -a args Starts the debugger and passes all subsequent arguments (specified by args) to the program specified by filename. The -a option must appear after all other TotalView options on the command line. |
| totalview srun -a -16 -ppdebug myprog Starts the debugger on a parallel MPI job. See the Starting an MPI Debug Session section for details. |
TotalView's Basic Look and Feel
Primary Windows
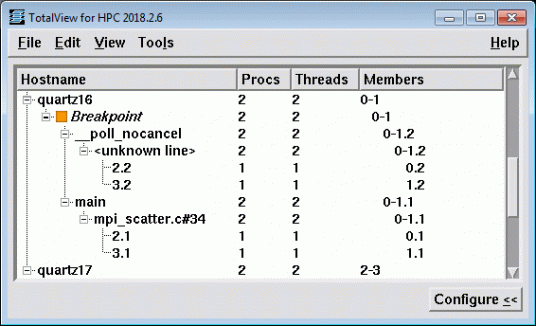
Root Window
- Will always appear when TotalView is started.
- Provides an overview of all processes and threads, showing the TotalView assigned ID, MPI rank, host, status and brief description/name for each.
- Allows sorting on each column of info that appears.
- Provides the ability to expand/collapse information under the Hostname column
- The "Configure" button allows selection of which information is displayed
- Pull-down menus - File, Edit, View, Tools, Help (menus are discussed later)
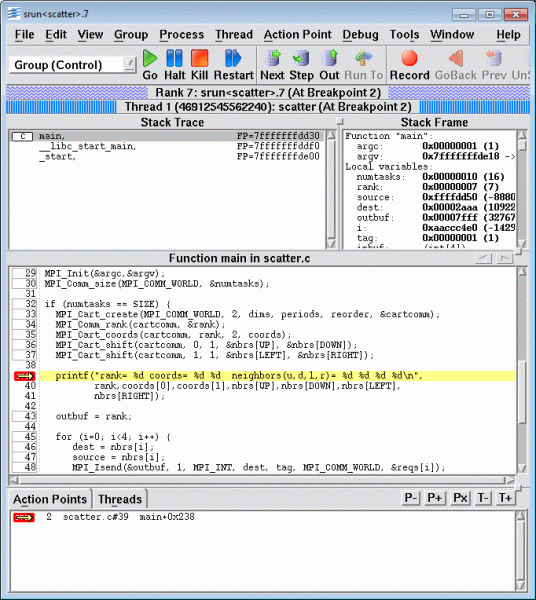
Process Window
- Usually (but not always) appears with the Root Window after TotalView is started.
- By default, a single process window will display. For multi-process / multi-threaded programs however, every process and every thread may have its own Process Window if desired.
- Comprised of:
- Pull-down menus
- Execution control buttons
- Navigation control buttons
- Process and thread status bars
- 4 "Panes"
- Stack Trace Pane
- Shows the call stack of routines the current executable is running
- Selection of any routine shown in the call stack will automatically update the Process Window with its information.
- Stack Frame Pane
- Displays the local variables, registers and function parameters for the selected executable.
- Register abbreviations and meanings are architecture specific. See the TotalView documentation for details.
- Source Pane
- Displays source/assembler for the currently selected program or function.
- Shows program counter, line numbers and any associated action points.
- Only "boxed" line numbers are eligible for debugging.
- Action Points, Threads Pane
- A multi-function pane. By default, it shows any action points (covered later) that have been set.
- May also select Threads to show associated threads.
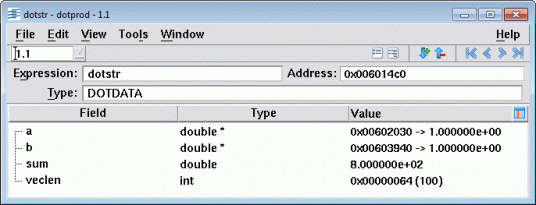
Variable Window
- Probably the most common window after the Root and Process windows.
- Appears when you dive (covered later) on a variable or select a menu item to view variable information.
- Displays detailed information about selected program variables. Also permits editing, diving, filtering and sorting of variable data.
- Comprised of a single pane, pull-down menus, data field boxes and several action buttons.
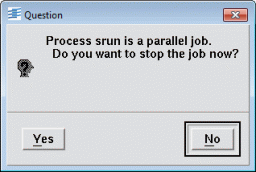
Dialog Boxes
- TotalView has numerous dialog boxes that are used for a variety of purposes:
- Solicit and confirm selections
- Display informational, warning and error messages
- Accept input
- Display and select options and preferences
- Display various types of information
- Dialog boxes vary in complexity. A few representative dialog boxes are shown here.
Mouse Usage
Much of your interaction with the TotalView debugger is through the use of a mouse. Each mouse button has a specific purpose, described below.
| Mouse Button | Purpose | Description |
|---|---|---|
| LEFT | Select / Dive | Single clicking on an object causes it to be selected and/or to perform its action. Double-clicking allows you to dive into an object. For example, double-clicking on an array object in the source pane will cause a new window to pop open, showing the array's values. |
| MIDDLE (if present) |
Paste | Writes information previously copied or cut into the clipboard at the cursor's position. |
| Dive | Display more information about an object | |
| RIGHT | Context menu | Pops-up a context-sensitive menu of commands related to the object clicked on (if applicable). |
Menus
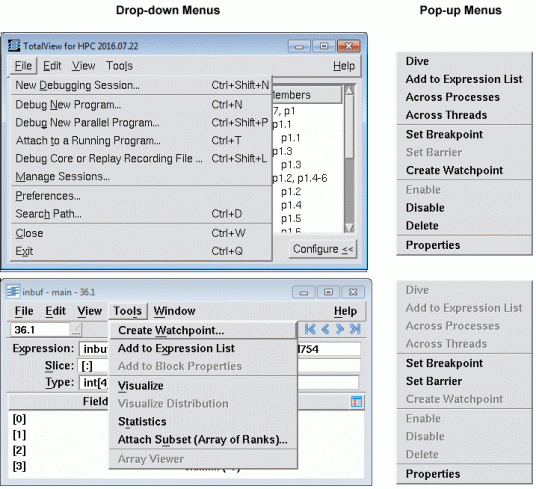
Two Types of Menus
- Drop-down menus:
- Visible
- Appear along the top border of most windows
- Activated by clicking with the left mouse button
- Some menu selections may have submenus
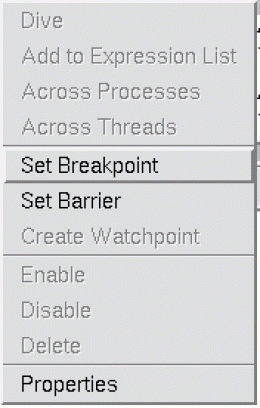
- Pop-up menus:
- Hidden
- Activated by clicking on an object (such as a variable, line number, etc.) with the right mouse button
- Not all objects possess pop-up menus
- Menus are context sensitive - different windows will have different menus.
- Dimmed menu selections are either irrelevant or not available.
- TotalView has many menus - too many to show here. Only a few representative menus are shown below - two drop-down menus and two pop-up menus.
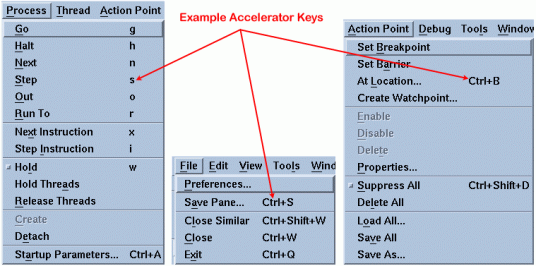
Accelerator Keys
Short Cut
- In addition to selecting actions from menus, you can also use TotalView's predefined accelerator keys to initiate most of the debugger's common functions.
- Saves time by skipping menu navigation.
- You can always find out which accelerator key to use by viewing the menu for the action - accelerator keys are shown on the right side of the menu where applicable.
- Important: accelerator keys are CASE SENSITIVE
Examples
Scrolling, Resizing and Memorizing
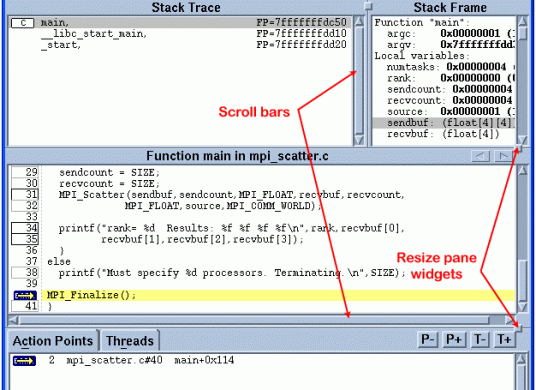
Conventional Scrolling Behavior
- Conventional scrollbars are used by most of TotalView's windows, pages, and panes.
- Scrolling can be accomplished by clicking and/or dragging with the left mouse button.
- The usual up-arrow, down-arrow, page up and page down keys can also be used for scrolling.
Resizing Windows and Panes
- All windows can be resized in the usual fashion by dragging window borders with the mouse to a new size/position.
- The Process Window panes can be also be resized by clicking and dragging on any resize widget.
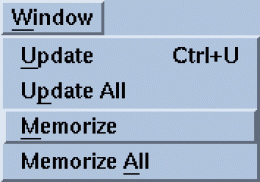
Memorizing Windows
- The "Window" menu (if present) will allow you to save the position and size of that window, or all windows.
- A convenience feature for those who like to have their TotalView sessions customized.
- Resized panes inside a window are not memorized.
Process and Thread State Codes
- TotalView uses colored single character State Codes to describe process and thread status information. These are also called State Codes.
- These codes appear in several places. One example is the Threads Pane of the Process Window, shown below.
- The table below lists TotalView's state codes.
| State Code | Description |
|---|---|
| B | Stopped at a breakpoint |
| E | Stopped because of an error |
| H | In a Hold state |
| K | Thread is executing within the kernel |
| M | Mixed - some threads in a process are running and some not |
| R | Running |
| T | Thread is stopped |
| W | At a watchpoint |
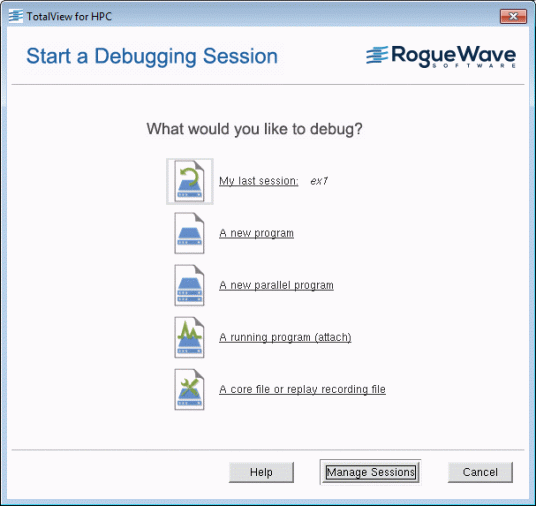
Session Manager
- Provides an easy way to:
- Launch a new program - serial or parallel
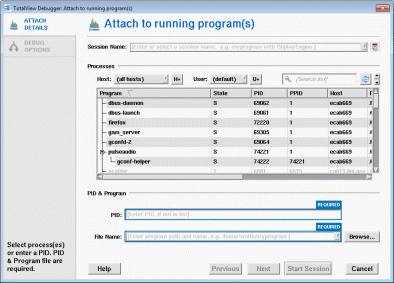
- Attach to a running program
- Load a core file
- Save a debug session for later
- Load a previously saved debug session
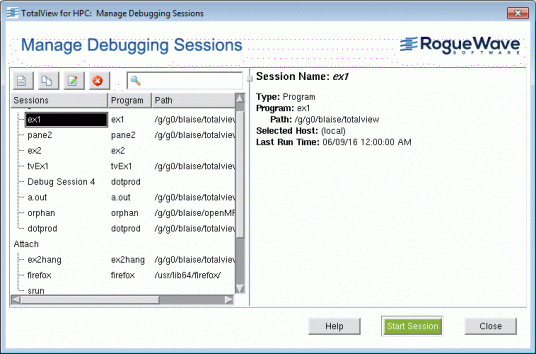
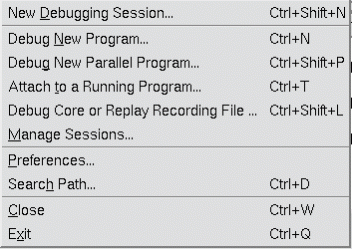
- The Session Manager window will appear automatically if you invoke the totalview command by itself without arguments. Shown below.
- Selecting "Manage Sessions" allows you to view and select from a list of current or previous debug sessions. Shown below:
- You can also get to the Manage Sessions window through the Root and Process window menus:
PATH Root Window > File Menu > Manage Sessions
PATH Process Window > File Menu > Manage Sessions
- The Session Manager is discussed further in other sections of this tutorial.
TotalView's Basic Functions
Viewing Source Code
- Source, Assembler or Both:
- The Process Window's Source Pane is used to display source code, assembler code or both.
- TotalView will attempt to display the source code by default. If it cannot find the source, then it will display assembler.
- Assembler can also be displayed with symbolic addresses rather than absolute addresses (default).
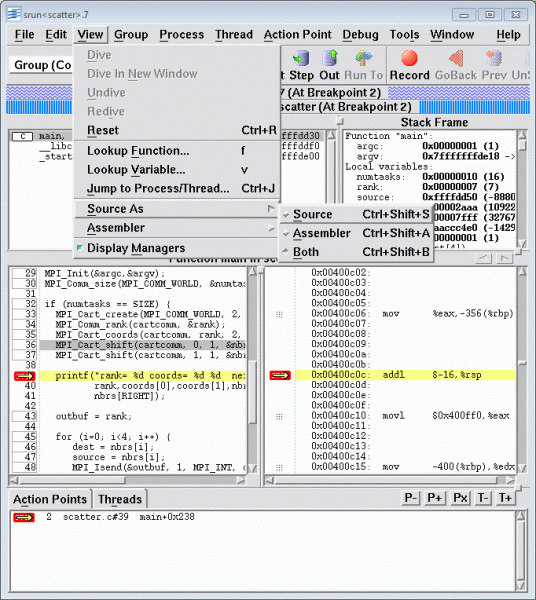
- To toggle between the different display modes:
PATH Process Window > View Menu > Source As
- An example of both source and assembler is shown below.
>Displaying Function / File Source Code
- Complex applications can include many different source files and many different functions. TotalView makes finding and displaying the source code for any of these easy:
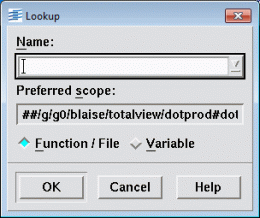
PATH Process Window > View Menu > Lookup Function
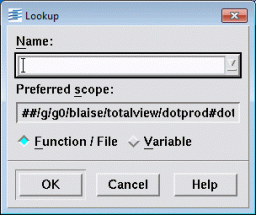
- A Function/File dialog box will then appear (below). Enter the name of the function or file desired. If found, TotalView will display its source in the Source Code Pane of the Process Window.
- Diving on a function will also cause TotalView to update the Source Pane with that function's source.
- If the function name is ambiguous (there are multiple occurrences), TotalView will open an Ambiguous Function Dialog Box and ask you to select from a list of possible functions.
Setting a Breakpoint
What Is a Breakpoint?
- A breakpoint is the most basic of TotalView's action points used to control a program's execution. It causes a process/thread to halt execution at the line number - prior to executing that line number.
- TotalView has three other types of action points (discussed later):
- Process barrier point
- Evaluation point
- Data watchpoint
- Breakpoints can be set in source code and assembler code.
- For regular source, only "boxed" line numbers are eligible for breakpoints. For assembler, instructions that display a box or a "gridget" are eligible.
Several Ways to Set / Unset a Breakpoint
- Method 1: The easiest way to set a breakpoint is to simply click on a source code line number with the left mouse button. A red STOP icon will then appear on the source line number, as shown below.
- Method 2: Right-click anywhere on the desired source line until the pop-up menu appears (right). Then select Set Breakpoint.
- Method 3: First, click on a source line to select it (make sure it's highlighted). Then use:
PATH Process Window > Action Point Menu > Set Breakpoint
- Method 4: For any arbitrary line number, use the path below. A dialog box will then open to prompt you for the line number.
PATH Process Window > Action Point Menu > At Location
- To unset the breakpoint, simply click on the red STOP icon or select "delete" from the pop-up menu or Action Point menu.
Viewing Breakpoints
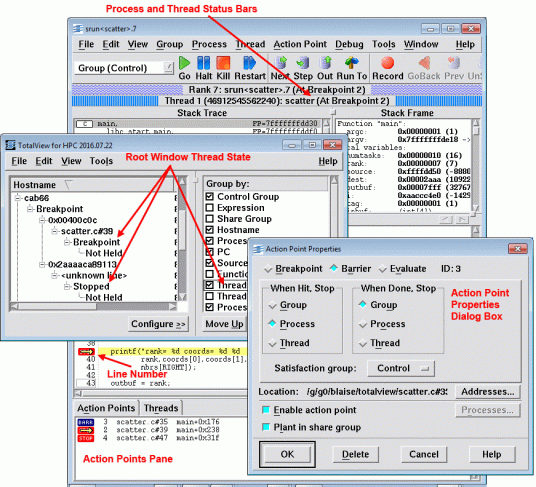
- TotalView displays breakpoint information in several locations, as shown below:
- As a "STOP" icon on the selected source line number
- Within the Action Points Pane
- Within the Action Point Properties Dialog Box
- In the Process Window's status bars
- In the Root Window state code column
- Within the Threads Pane (not shown)
Breakpoint Options
- TotalView provides a means for selecting how breakpoints behave across multi-process / multi-threaded programs. This topic is further discussed in Part 3: Debugging Parallel Codes.
Controlling Execution
- Controlling the execution of a program within TotalView involves two decisions:
- Selecting the appropriate command
- Deciding upon the scope of the chosen command
- Both of these are performed via the Process Window, and are discussed below.
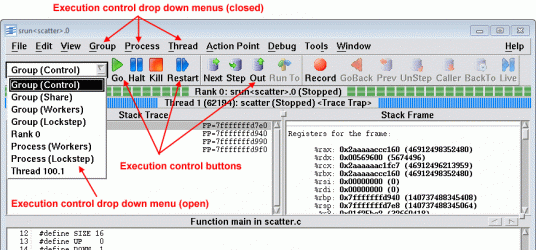
Execution Control Commands
- TotalView enables you to control program execution three different ways:
- Whichever of the three methods you choose, the same basic commands apply. The table below describes the basic execution control commands.
| Command | Description |
|---|---|
| Go | Start/resume execution |
| Halt | Stop execution |
| Kill | Terminate the job |
| Next | Run the next source line or instruction. If the next line/instruction calls a function, the entire function will be executed and control will return to the next source line or instruction (the function is "stepped over"). |
| Step | Run the next source line or instruction. If the next line/instruction calls a function, the function will be "stepped into". Execution will stop within the function. |
| Out | Execute to the completion of a function. Returns to the instruction after the one which called the function. |
| Run To | Allows you to arbitrarily click on any source line and then run to that point (must click on a source line first) |
| Next Instruction | Similar to Next, but applies only to machine instructions |
| Step Instruction | Similar to Step, but applies only to machine instructions |
| Hold/Release | Hold ignores other commands to resume execution Release allows other run commands to have effect |
| Restart | Restarts a running program, or one that has stopped without exiting |
| Set PC | Sets the Program Counter to a desired source line, machine instruction, or absolute address |
Group, Process, Thread Command Scopes
- For serial programs, execution scope is not an issue because there is only one execution stream. For parallel programs, execution scope is critical - you need to know which processes and/or threads your execution command will effect.
- Most of TotalView's execution control commands can be applied at the Group, Process or Thread scoping level. The right scope depends upon what you want to effect.
- Command scope can be selected from the execution scope drop-down menu located next to the execution control keys (shown above) or for the appropriate command on the Group, Process and Thread drop-down menus.
- Group scope:
- PATH Process Window > Group Menu
- Executes the command on all processes within a specified group.
- Usually used for a multi-process parallel program.
- Can be used for a single process serial program (number of group members = one).
- Process scope:
- PATH Process Window > Process Menu
- For a multi-process program, executes the command on a single selected process.
- Some subtleties in behavior exist if the process is multi-threaded, but generally the command influences all threads owned by the process.
- Can be used for a single process serial program.
- Thread scope:
- PATH Process Window > Thread Menu
- Usually used to execute the command on a single thread of a multi-threaded process.
- Behavior can differ between machine architectures.
- Can be used for single process, single threaded serial program also.
- Additional details about Group, Process and Thread commands usage are discussed later in Part 3: Debugging Parallel Codes.
Diving
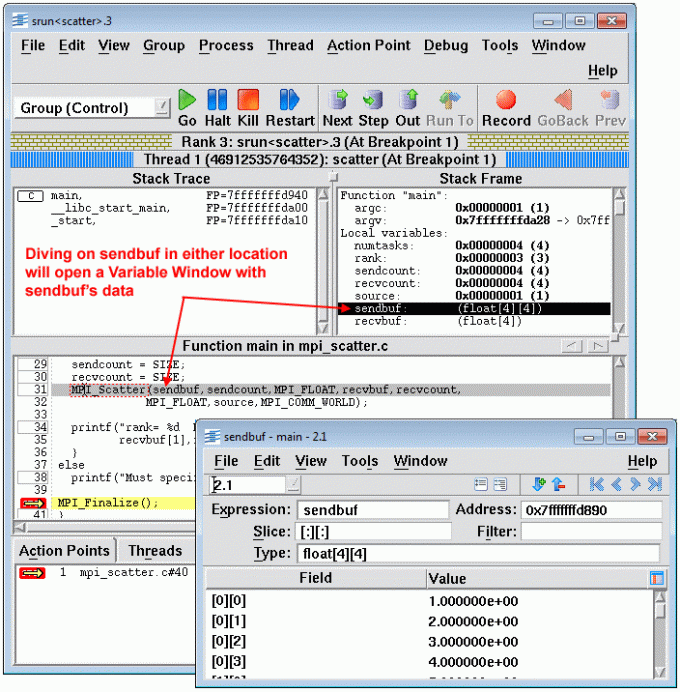
- TotalView enables you to view more detail about a data containing object (such as an array variable) by "diving" into it.
- Diving can be accomplished by several different methods:
- Double left-clicking on an object
- Right-clicking on an object and then selecting Dive from the resulting pop-up menu (if applicable)
- Selecting Dive from any window's View menu (if applicable)
- Clicking on an object with the middle mouse button
- What happens when you dive on an object depends upon the object. The table below describes most cases.
| Object | Where Object is Located | What Happens |
|---|---|---|
| Process or thread | Root Window | Process/thread is displayed in an existing Process Window. If none exists, then a new Process Window appears for the selected process/thread. |
| Routine | Process Window Stack Trace Pane | Stack Frame and Source Code panes in the Process Window are updated with information for the selected routine. |
| Subroutine | Process Window (in Source Code Pane) | Source code appears in the Process Window. |
| Pointer | Process Window | Referenced memory area appears in a new Variable Window. |
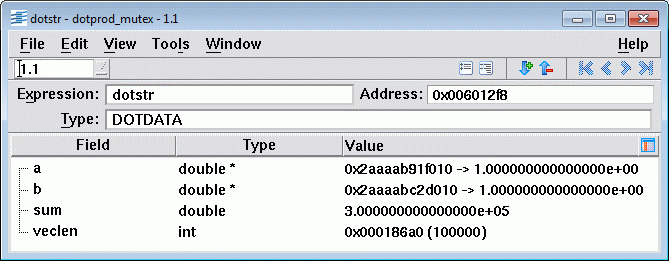
| Variable, array, address | Process Window | Variable contents appear in a new a Variable Window. |
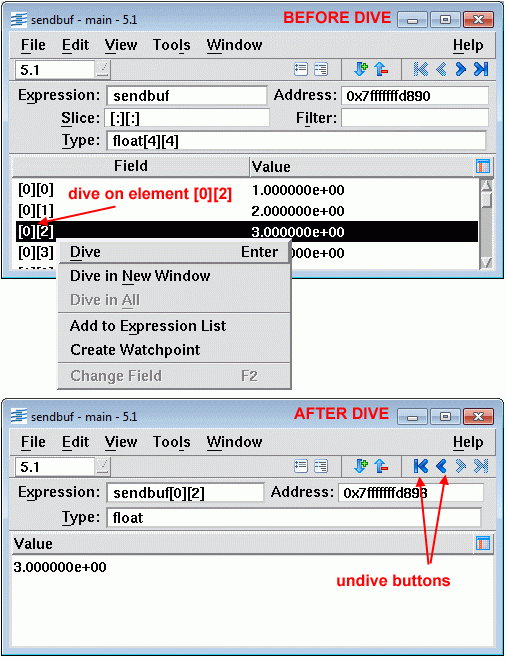
| Element of an array or structure | Variable Window | Contents of element appear in the Variable Window. Example of a "nested" dive. |
Example
Nested Dives and Undiving
- Some dives create new windows and some use existing windows to display their data. Dives that use existing windows are called nested dives because the new information replaces the previous information.
- Examples of nested dives:
- Diving on a subroutine in the Process Window's Source Pane. The source for the subroutine replaces whatever was already in the Source Pane.
- Diving on an array element in a Variable Window. The single element's data replaces the entire array in the Variable Window (example below).
- Nested dives do not actually destroy the previously displayed information. Instead they push it on a stack so that it can be returned to later if desired.
- "Going back" in window history is called "undiving" and can be accomplished in two ways:
- Method 1: Click on the "undive" button that appears in the upper right quadrant of a window (shown above).
- Method 2: Select Undive from a window's View menu (if applicable).
Viewing and Modifying Data
Viewing Data
- TotalView allows you to view variables, registers, areas of memory and machine instructions, as discussed below.
- Variables
- Method 1: Dive on any variable that appears in the Source Pane or Stack Frame Pane of the Process Window.
- Method 2: Use the variable lookup command: PATH Process Window > View Menu > Lookup Variable
- Registers
- Dive on any register that appears in the Stack Frame Pane of the Process Window.
- Memory Areas
- Use the variable lookup command: PATH Process Window > View Menu > Lookup Variable
- Then enter either a hexadecimal address (must start with 0x) for a single location. Enter two hexadecimal addresses for a range.
- Machine Instructions
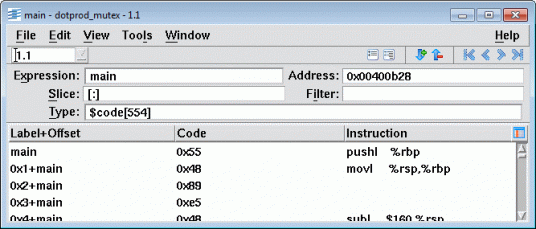
- Dive into the address of an assembler instruction in the Process Window Source Pane. The instructions for the entire function will display in a Variable Window.
- Leaving a Variable Window open allows you to perform runtime monitoring of variables. TotalView will update its contents each time the program is stopped.
Examples
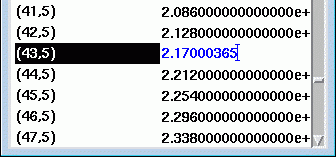
Modifying Variable Data
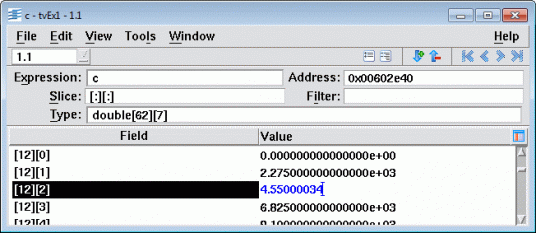
- You can edit variables from within the Variable Window. Simply click on the variable with the Select (left) mouse button. This will select the variable for field editing.
- The Variable Window below demonstrates editing an array element. Notice that the array element being edited is highlighted and shows a field editor cursor.
- The modified variable has effect when the program resumes execution.
Arrays
- For array data, TotalView provides several additional features:
- Displaying array slices
- Data filtering
- Data Sorting
- Array statistics
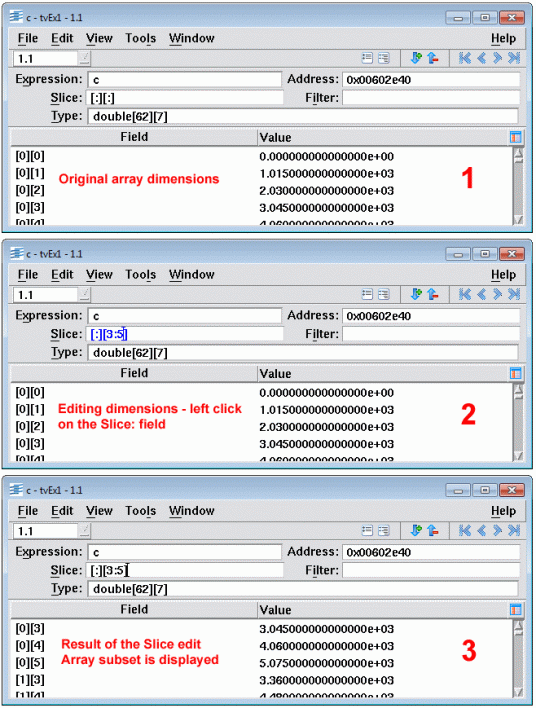
Displaying Array Slices
- Used to display subsections of an array. Particularly useful if only a small section of a large array is of interest.
- Can be entered in the Slice: field in the Variable Window.
- Syntax is lower_bound:upper_bound:stride and may be specified for each dimension.
- Examples:
| Fortran | Slice: (1:5, 3:8) |
|---|---|
| C/C++ | Slice: [::2][1:20] |
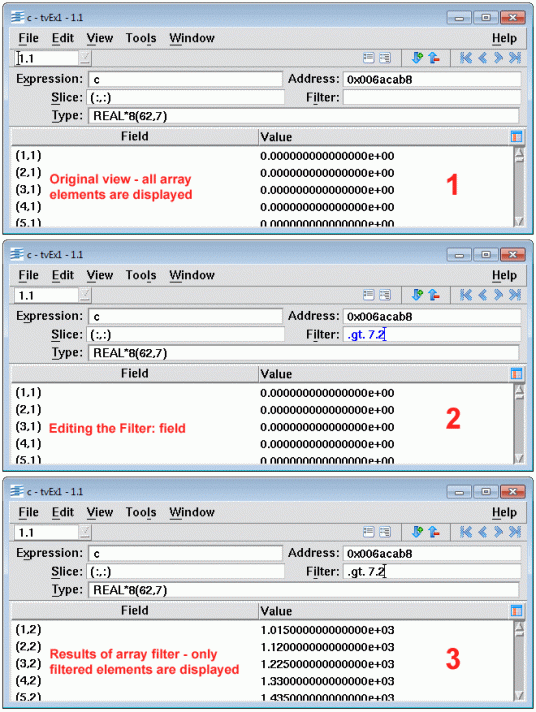
Array Data Filtering
- Arrays containing data types of character, integer or floating point can be filtered to display only desired data.
- Can be entered in the Filter: field in the Variable Window.
- By arithmetic comparison
- C/C++: == != < <= > >=
- Fortran: .eq. .ne. .lt. .le. .gt. .ge.
- Equal/not equal to IEEE values: $nan $nanq $nans $inf $pinf $ninf $denorm $pdenorm $ndenorm
- By a range of values
- Within an expression
- See the TotalView documentation for additional examples, syntax options and other important information.
- Examples:
| Fortran | .gt. 250 .eq. $nan 7:512 (.gt. 0 && .lt. 50) .or. (.gt. 100 .and. .lt. 150) |
|---|---|
| C/C++ | >= 100 != $inf 128:<1024 (> 0 && < 50) || (> 100 && < 150) |
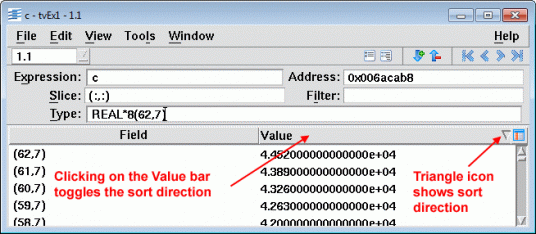
Sorting Array Data
- Simply click on the Value bar in a Variable Window. The array will sort in ascending order. Clicking again will cause it to sort in descending order. Clicking a third time will return the array to its original order.
- Note: Sorting takes place internal to TotalView and not actually within your data.
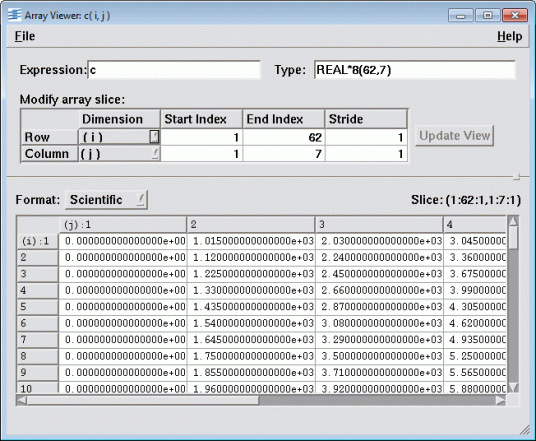
Array Viewer
- To view a multi-dimensional array in "spreadsheet" format: PATH Variable Window > Tools Menu > Array Viewer
- For arrays with more than 2 dimensions, a "slice" of the array will be presented. You can then specify different slices.
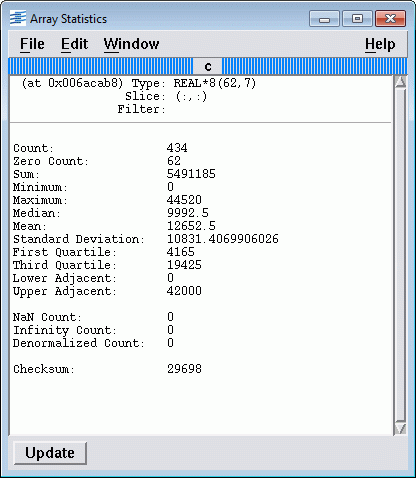
Array Statistics
- TotalView is able to display some basic statistics about an array: PATH Variable Window > Tools Menu > Statistics
- A window containing statistical information about your array will appear - example below.
- See the TotalView documentation for an explanation of the statistics fields.
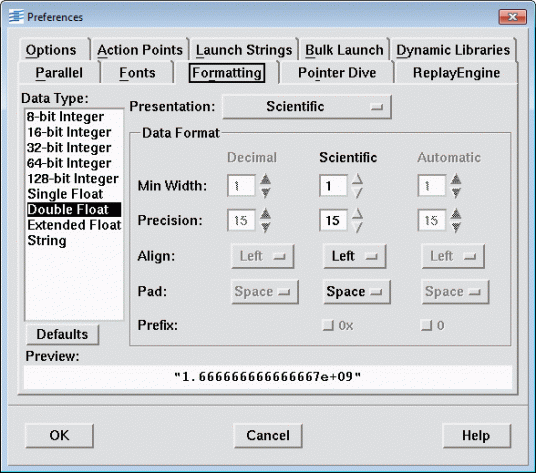
Changing Variable Display Format
- You can specify how your variable data should be displayed. This is done through TotalViews Preferences dialog box.
- Select any one:
- PATH Process Window > File Menu > Preferences
- PATH Root Window > File Menu > Preferences
- PATH Variable Window > File Menu > Preferences
- The Preferences dialog box will appear. Select the Formatting tab to change the way TotalView displays variables.
Changing Variable Data Types
- TotalView will display variables according to their declaration type in your program. In most cases, the TotalView types are identical to their programming language counterparts (C language pointers to arrays are an exception). See the TotalView documentation for details.
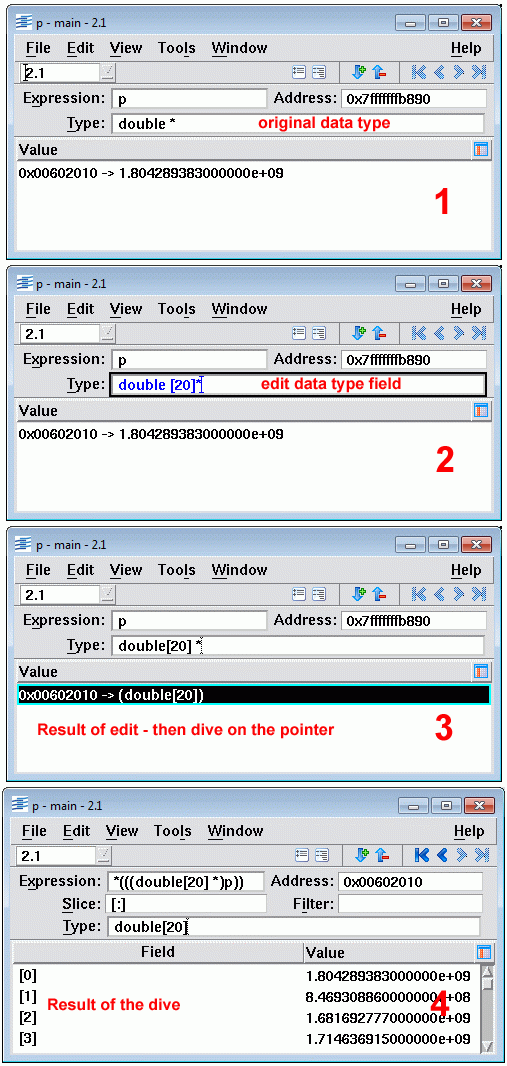
- You can change the way variables are displayed by editing the data type shown for them in the Variable Window. Simply left mouse click on the data type field and then edit as desired.
- An example of how this might be useful would be for displaying the contents of a dynamically allocated array using a C pointer. For example:
double *p;
...
p = (double *)malloc(sizeof(double) * 20);
- TotalView does not know that p actually points to an array of doubles. By changing the data type to double[20]* and then diving on the pointer, you can view the array. The example below demonstrate this.
Text Editing and Searching
Text Editing
- TotalView provides a basic field editor for use within certain debugger fields and windows. Text which can be edited will be highlighted and display a field editor cursor.
- Cutting and pasting can be accomplished by using the middle mouse button or by selecting Cut, Copy, or Paste from any window's Edit pull-down menu.
Text Searching
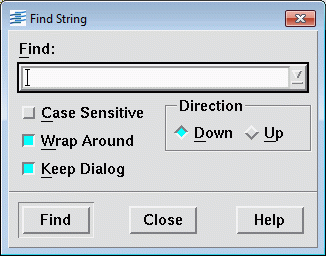
- Most TotalView windows will permit you to search for text strings. Simply select Find from any window's Edit pull-down menu.
- A dialog box will appear for you to enter the string to search for, plus any search options, as shown below.
- Select Find Again from the same Edit menu to repeat a search.
Saving Window Contents
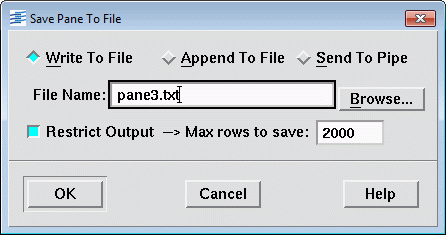
Most TotalView windows enable you to save their contents as ASCII text. You can also pipe the contents to UNIX shell commands.
For windows with multiple panes, you have to save each pane individually.
Make sure your mouse pointer is in the window or pane of interest. Then select Save Pane from any window's File pull-down menu. A dialog box will then appear for your input, as shown below:
Example Original Stack Frame pane
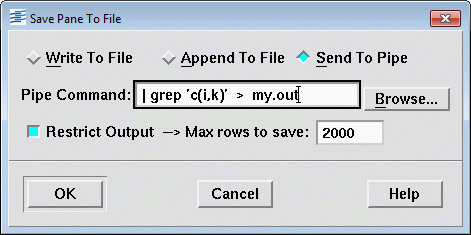
- Using the "Send To Pipe" option allows you to direct the pane/window contents to a UNIX shell command. The command is entered in the File Name box. For example:
- Unless specified otherwise, output from the command appears as stdout in the window where you started TotalView.
Getting Help
- TotalView provides an extensive, web browser based online Help system.
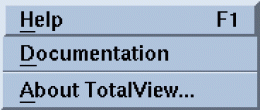
- All primary TotalView windows have a Help pull-down menu that includes access to the vendor's complete set of product documentation.
- Context-sensitive help is available by left-clicking on an object and then selecting "Help" from the Help pull-down menu, or hitting the F1 key.
- Additionally, many dialog boxes have a context-sensitive Help button.
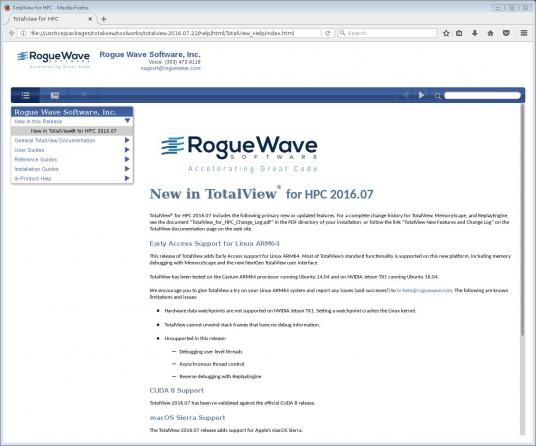
- The Help pull-down menu and Help Documentation are shown below.
Exiting TotalView
- You can exit the debugger in several ways:
- From any window select File Menu > Exit
- Typing CTRL-q or CTRL-Q in any window
- Closing the Root Window via your window manager
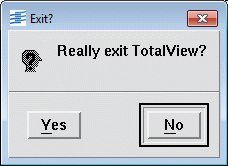
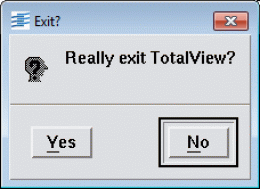
- After selecting any of these ways to exit TotalView, you will be prompted to confirm your choice to exit:
This concludes TotalView Part 1. Where would you like to go now?
- Back to the top of Part 1
- Continue to Part 2: Common Functions
- Jump to Part 3: Debugging Parallel Programs


