TotalView is a sophisticated and powerful tool used for debugging and analyzing both serial and parallel programs. TotalView provides source level debugging for serial, parallel, multi-process, multi-threaded, accelerator/GPU and hybrid applications written in C/C++ and Fortran. Most HPC platforms and systems are supported. Both a graphical user interface and command line interface are provided. Advanced, dynamic memory debugging tools and the ability to perform "replay" debugging are two additional features. TotalView has been selected as the DOE ASC Program's debugger of choice for its HPC platforms.
Platforms and Locations
| Platform | Location | Notes |
|---|---|---|
| x86_64 Linux | /usr/tce/packages/totalview/toolworks/ | Multiple versions are available. Load with modules. |
| CORAL | /usr/tce/packages/totalview/toolworks/ | Multiple versions are available. Load with modules. |
Quick Start
At LC, most of the "setup" for using TotalView is automatically provided for users. In fact, the default version of TotalView is included in every user's path, and unless an alternate version is desired, it is not necessary to load a module.
1. Compiling: source code needs to be compiled with the -g flag. Additionally, optimization flags should not be used (if possible) as compiler optimizations can "rewrite" your program and produce machine code that doesn't necessarily match your source code.
2. Optional: see what versions of TotalView are available if you desire a version other than the default version, and load the dotkit package of choice. In the example below, the default version of TotalView is loaded for illustrative purposes.
module avail totalview
------------------------ /collab/usr/global/tools/modulefiles/toss_4_x86_64_ib/Core -------------------------
totalview/2024.1.21 totalview/2024.3.10 totalview/2025X.3.1924 totalview/2025.2.6
totalview/2024.2.11 totalview/2024.4.2 (D) totalview/2025.1.13
3. Start TotalView: there are several different ways to start the debugger, depending upon what you want to do. Three examples for starting the TotalView GUI are shown below:
- Standalone, as might be done in order to attach to a running process
- With a serial code, or single process threaded code
- With a parallel MPI code (with or without threads) under SLURM in the pdebug partition
1% totalview &

2% totalview myapp &

3% totalview srun -a -N4 -n32 -p pdebug myapp &
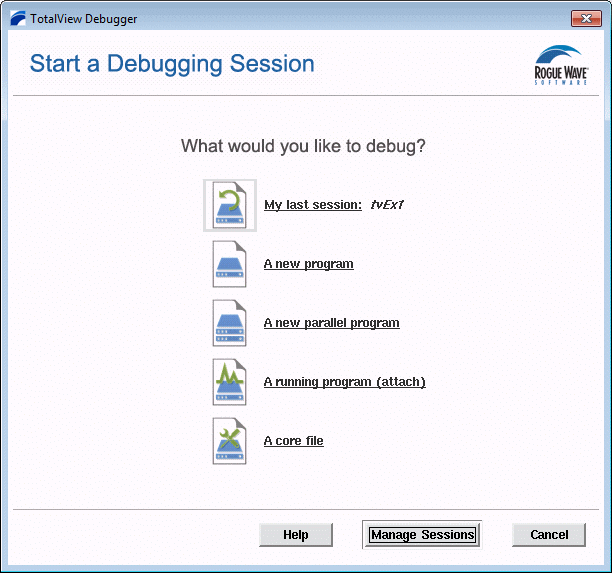
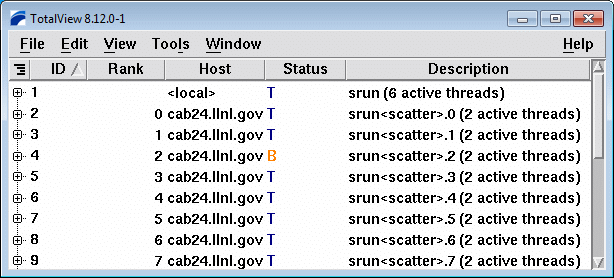
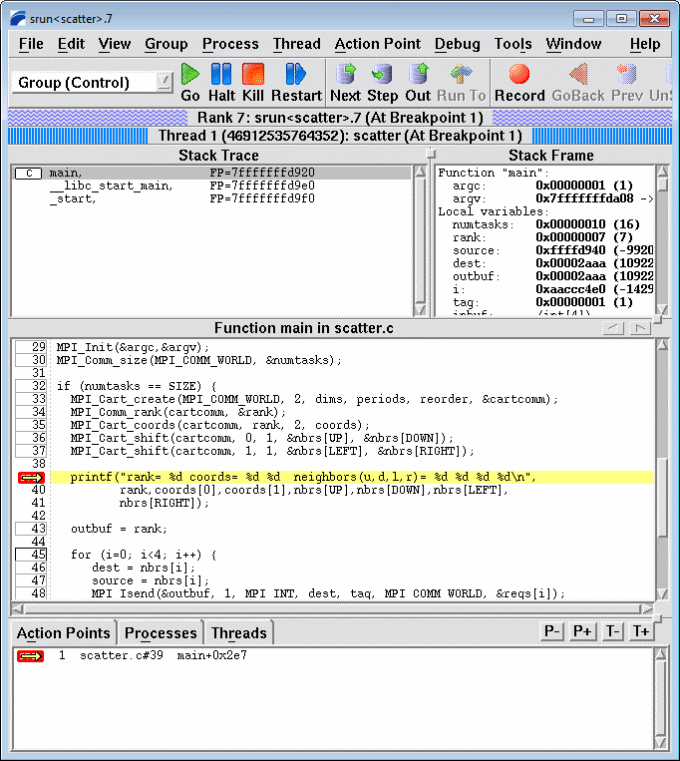
4. What happens next depends upon how you started TotalView. If you started it Standalone, only the Session Manager window will appear. If you started it with an application (serial or parallel) the Root and Process windows will appear. Examples of all three windows are shown below (click for larger image).
5. You are now ready to begin debugging.
Because TotalView is a full-featured tool, detailed instructions are not provided here. Instead, users can consult LC's TotalView tutorial as a starting point for becoming familiar with TotalView's functionality.
Troubleshooting
- Consult the vendor documentation (below)
- Contact the LC Hotline to report a problem.
Documentation and References
- TotalView provides complete documentation on their website: https://help.totalview.io/. Currently, product documentation is located under the "Help" menu.
- The TotalView installation directories contain product documentation in PDF format. See the doc/ subdirectory.
- LC's TotalView tutorial


