Valgrind's Memcheck Tool Overview | Platforms and Locations | Quick Start | Tool Gear's MemcheckView Package Overview | Preparing Your Application for Memcheck | Selecting an Input Considering Time and Memory Limits | mpi_vg_demo2: A Pathologically Bad MPI Example Program | Using 'memcheck' to Check Serial (Non-MPI) Applications | Using 'memcheck_all' to Check Parallel (MPI) Applications | Using 'memcheckview' to View Memcheck's Output in GUI | What If I Don't Want to Use a GUI to View Memcheck's Output? | Changing GUI Fonts and Selecting a Message to View | Viewing Just One Category of Memcheck Messages | Deciphering "Invalid Free()/Delete/Delete[]" Messages and GUI Navigation | Deciphering "Write of an Invalid Address" Messages | Deciphering "Read of an Invalid Address" Messages | Examining Memcheck Messages Located in Library Calls and Navigating Call Stacks | Deciphering "Conditional Jump or Move Depends on Uninitialized Value" Messages | Client Check Requests and Memcheck's MPI wrappers | Which Memcheck Messages Are Safe to Ignore? | Deciphering Error Message Counts | Deciphering "N Bytes in M Blocks Are Definitely Lost" Messages | Deciphering "N Bytes in M Blocks Are Possibly Lost" Messages | Deciphering "N Bytes in M Blocks Are Still Reachable" messages | Need More Help? | Documentation and References
This document describes how to use and interpret the results of Valgrind's Memcheck tool on LLNL's Linux-based supercomputers. The goal is to avoid many of the common gotchas other users have encountered and to help interpret Memcheck's results as efficiently as possible.
This document is oriented to the use of Tool Gear's MemcheckView GUI to interpret Memcheck's results and the use of Tool Gear's helper scripts, memcheck_all and memcheck, to run Memcheck on parallel and serial applications. To provide concrete examples, Memcheck's output for a pathologically bad MPI application is analyzed throughout this document. All the Valgrind and Tool Gear software discussed on this page is open source and is installed in /usr/local/bin on all of LLNL's Linux-based supercomputers.
This documentation may contain minor differences in message wording, folder titles, etc., when compared to the output of the currently installed software on LLNL's supercomputers because LLNL upgrades to new versions of Valgrind and MemcheckView shortly after they become available. (The screen shots and example output used in this documentation was created using a pre-release version of Valgrind 3.2.0 (SVN-1600-5778) and the release version of Tool Gear's MemcheckView 2.00 package.)
Valgrind's Memcheck Tool Overview
Valgrind is a suite of simulation-based debugging and profiling tools for programs running on LLNL Linux clusters. Valgrind's Memcheck tool detects a comprehensive set of memory errors, including reads and writes of unallocated or freed memory and memory leaks. The Valgrind User Manual and its Memcheck section describe in detail how Valgrind and Memcheck work, the options for use, and more details about what causes false positives.
Memcheck is part the Valgrind suite of simulation-based debugging and profiling tools. Memcheck detects memory-management problems, and is aimed primarily at C and C++ programs. When a program is run under Memcheck's supervision, all reads and writes of memory are checked, and calls to malloc/new/free/delete are intercepted. As a result, Memcheck can detect if your program:
- Accesses memory it shouldn't (areas not yet allocated, areas that have been freed, areas past the end of heap blocks, inaccessible areas of the stack).
- Uses uninitialized values in dangerous ways.
- Leaks memory.
- Does bad frees of heap blocks (double frees, mismatched frees).
- Passes overlapping source and destination memory blocks to memcpy() and related functions.
Memcheck reports these errors as soon as they occur, giving the source line number at which it occurred, and also a stack trace of the functions called to reach that line. Memcheck tracks addressability at the byte-level, and initialization of values at the bit-level. As a result, it can detect the use of single uninitialized bits, and does not report spurious errors on bitfield operations. Memcheck runs programs about 10-30x slower than normal.
Platforms and Locations
| x86_64 Linux | /usr/local/bin/memcheck* | Multiple versions are available. Use Dotkit to load. |
Quick Start
Tool Gear's MemcheckView Package Overview
Tool Gear is an open source infrastructure for creating debugging and performance tool GUIs quickly. Tool Gear was designed and implemented by John Gyllenhaal, John May, and Martin Schulz at LLNL.
Tool Gear's MemcheckView package provides the Memcheck GUI used (memcheckview) and script interfaces used (memcheck, memcheck_all) to run Memcheck either serially or in parallel (on MPI applications). The MemcheckView package was designed and implemented by John Gyllenhaal at LLNL.
Preparing Your Application for Memcheck
Memcheck works best on unoptimized debuggable applications (i.e., -g and no -O). Memcheck does work with optimized applications but may report uninitialized-value errors that do not really exist and incorrect line numbers. The run-time savings from running optimized code may not be worth the often significant extra effort required when interpreting the results. Recent Memcheck versions are reported to significantly reduce false positives in optimized code, so using optimized code may be reasonable for some applications.
It is very important to disable any special memory managers (e.g., memory pool algorithms) or other memory debugging tools in the application. Malloc and free wrappers are fine as long as they actually call malloc or free every time the malloc or free wrapper is called. The use of special memory managers usually seriously cripples Memcheck's (and other memory tools') ability to find errors. For advanced users, the Memcheck Client Request interface can be used to instrument your own memory management library, or even your application, so that Memcheck can detect more memory errors.
Selecting an Input Considering Time and Memory Limits
Valgrind's Memcheck tool slows down most LLNL applications by a factor of 40 to 120. (Heavily threaded programs may slow down even more.) Some LLNL applications start up very slowly under Memcheck. (It may take a few minutes before you get to the first printf.) The best strategy for using Memcheck is to run on the shortest input (ideally, a simulation cycle or two) that exhibits the problem. You will probably need to adjust batch time limits appropriately to account for the much longer run time (and running overnight may be required).
Valgrind's Memcheck tool can double the amount of memory used (1.25x malloc size + ~120-byte overhead for each malloc), so you may either need to reduce your input size or run only half as many processors per node (to prevent swapping or running out of memory).
mpi_vg_demo2: A Pathologically Bad MPI Example Program
The source code and memcheck_all output for the pathologically bad MPI program, mpi_vg_demo2, that is used in this document can be found in Memcheck demos/memcheck directory (/usr/local/tools/memcheckview/demos/memcheck on LLNL machines). All the screenshots in this document were taken after running memcheckview mpi_vg_demo2.95944.0.mc in the demos/memcheck directory (memcheckview is in /usr/local/bin on LLNL machines). The mpi_vg_demo2 executable was built from mpi_vg_demo2.c. However, when going through this document, it may more be useful to refer to this version of mpi_vg_demo2.c with line numbers (which opens a separate window).
The MPI executable, mpi_vg_demo2, was built at LLNL using the following compile line:
mpiicc -g -o mpi_vg_demo2 mpi_vg_demo2.c
Using 'memcheck' to Check Serial (Non-MPI) Applications
For serial (non-MPI) programs, use the script 'memcheck' to run Valgrind on your application (e.g., memcheck ./a.out). The memcheck script turns on all the error and leak checking options and starts the memcheckview GUI on Valgrind's Memcheck output. Run memcheck with no arguments for more usage information; at LLNL, it should be in your path (/usr/local/bin).
Using 'memcheck_all' to Check Parallel (MPI) Applications
In order to run Valgrind's Memcheck tool on all tasks of an MPI application, place 'memcheck_all' just before your application name (see sample below) on the srun command line. The memcheck_all script may be used either interactively or in batch scripts. (It does not automatically display the GUI, so it is safe in batch mode.) For detailed memcheck_all usage information, run memcheck_all with no arguments on the command line. The sample below shows running memcheck_all on mpi_vg_demo2 interactively in the debug partition with two nodes and two MPI tasks.
> srun -ppdebug -n 2 -N 2 memcheck_all mpi_vg_demo2
  Running valgrind-3.2.0.SVN-1600-5778 Memcheck on task 0 on pengra4:
    Use 'memcheckview mpi_vg_demo2.95944.0.mc' to start GUI on task 0 output
  Running valgrind-3.2.0.SVN-1600-5778 Memcheck on task 1 on pengra5:
    Use 'memcheckview mpi_vg_demo2.95944.1.mc' to start GUI on task 1 output
  Number of tasks= 2 My rank= 0 Send to 1 Recv from 1
  Number of tasks= 2 My rank= 1 Send to 0 Recv from 0
  Sum over initialized data for rank 0 is 105
  Sum over uninitialized data for rank 0 is 105
  Sum over initialized data for rank 1 is 105
  Sum over uninitialized data for rank 1 is 105
Using 'memcheckview' to View Memcheck's Output in GUI
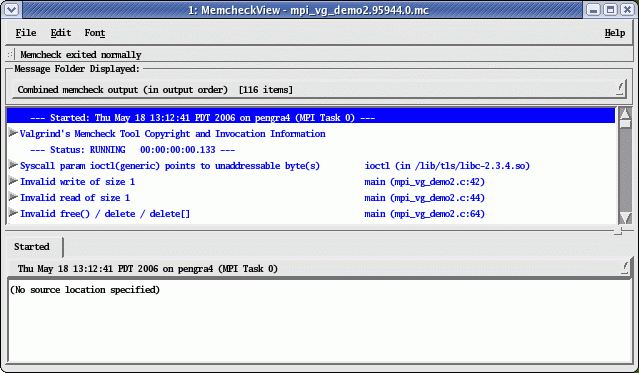
The Memcheck output created by using memcheck_all on mpi_vg_demo2 (see sample above) for MPI task 0 can be viewed by running memcheckview mpi_vg_demo2.95944.0.mc. The initial GUI view (Figure 1) contains all the Valgrind Memcheck tool messages in the order they were output by Memcheck. The first line displayed in the GUI (highlighted) indicates what MPI Task the output is for (i.e., 0), what node that MPI task was run on (i.e., pengra 4), and when the run started (i.e., May 18). (One of more MPI task's output files may be listed on the command line. Memcheckview will combine all of the listed output files into one display.)
What If I Don't Want to Use a GUI to View Memcheck's Output?
If you want text output instead of XML output required by the GUI, pass --xml=no to either memcheck or memcheck_all. Run memcheck or memcheck_all with no arguments for more details.
Changing GUI Fonts and Selecting a Message to View
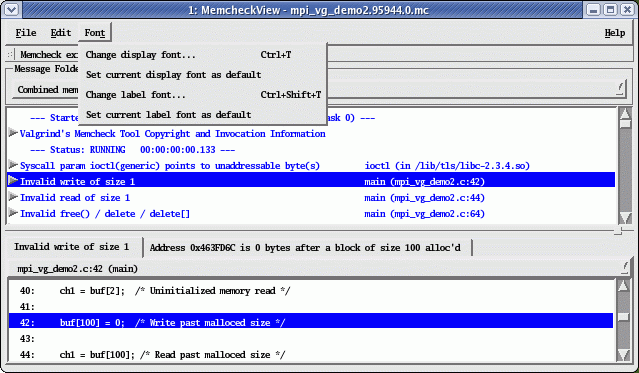
For some systems at LLNL, the default X11 font can be unreadably small. Unreadable fonts can be corrected by using the Fonts menu (see Figure 2).
After selecting the desired text display and menu label fonts, using the menu choices "Font, Set current display font as default" and "Font, Set current label font as default" is recommended so that you will never have to set the fonts again.
Initially, only the subject line of each message is shown in the GUI. A single click on a message (i.e., Invalid write of size 1) will highlight the message (as shown in Figure 2) and display the source line where to error occurred (line 42) in the bottom source pane. Clicking the arrow to the left of the message (or double clicking the message) will show/hide all the message details provided by Valgrind's Memcheck tool (typically the call stack traceback for error and/or auxiliary locations).
Viewing Just One Category of Memcheck Messages
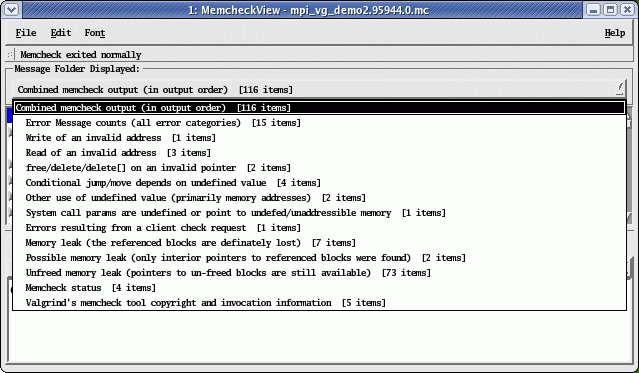
The memcheckview GUI also allows the Memcheck messages to be viewed by category. Clicking on the "Message Folder Displayed" combo box brings up a list of all the message categories available (Figure 3). The number of messages in each category is shown immediately to the right of each category name and only categories with at least one message are shown. Simply click on the message category you wish to examine to pull up just those messages. If there is a message present in every possible category, a scroll bar may appear in the combo box (not shown in Figure 3).
The three most critical message categories (free/delete/delete[] on an invalid pointer, write of an invalid address, and read of an invalid address) are at the top of the list and should be examined first (if there are messages in those categories). Freeing or deleting invalid pointers can cause such subtle (and often impossible to debug) memory problems that all messages in the "free/delete/delete[] of an invalid pointer" category typically should be resolved before even looking at the other message categories (except for perhaps hints on why the invalid frees are occurring).
The rest of this document describes how to decipher the most common Memcheck messages and how to use the GUI to aid in deciphering these messages.
Deciphering "Invalid Free()/Delete/Delete[]" Messages and GUI Navigation
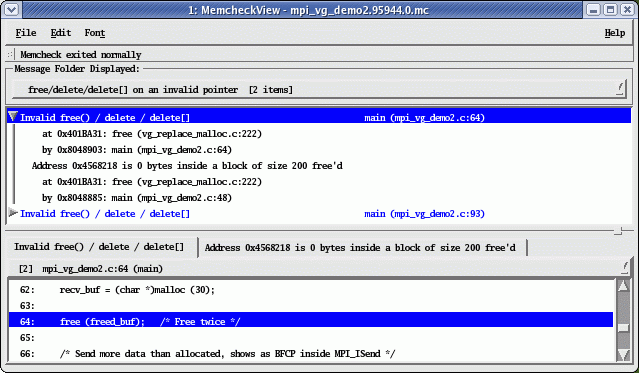
In Figure 4, Memcheck detected an invalid free (highlighted) on line 64 of mpi_vg_demo2.c of a buffer already freed on line 48 of mpi_vg_demo2.c. (The free calls on line 222 of vg_replace_malloc.c are from Memcheck's instrumentation library, and generally functions from vg_replace_malloc.c should be ignored in the call stacks.) In the message (top) pane, the arrow at the left of the highlighted invalid free message has been clicked so that all the call stack details for both the invalid free and the earlier valid free of the same data is shown.
The source (bottom) pane shows the source code where the invalid free occurred (Figure 4). The invalid free's source code is displayed because the first source tab, labeled "Invalid free()/delete/delete[]," has been selected (by default).
The second source tab (and the message body) indicates that "Address 0x4568218 is 0 bytes inside a block of size 200 free'd." The "0 bytes inside" part of this message indicates that the address passed to free would likely have been valid to free if it hadn't already been freed on line 48. Clicking on this second source tab would display the source code on line 48 where the buffer was initially freed:
48: free (buf);
If in Memcheck's message the address is not "0 bytes inside" a freed block, then either there is something much more seriously wrong (e.g., the address is corrupted, uninitialized, or something that should not be freed) or the data pointed to was freed so long ago (relatively) that Memcheck no longer has a record of the initial free.
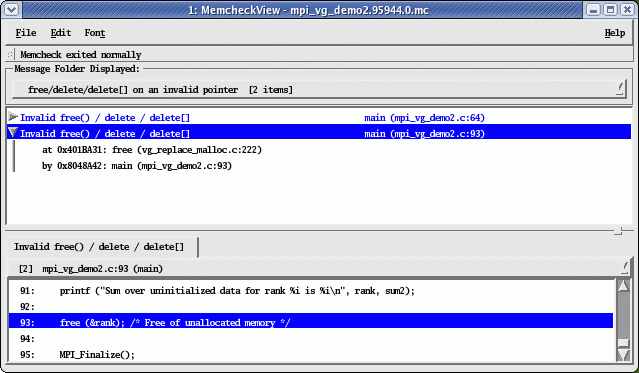
In Figure 5, Memcheck detected an invalid free on line 93 of mpi_vg_demo2.c. Memcheck cannot find any currently or previously allocated block close to the address passed to free, so no "Address..." message and traceback is displayed (as it was in Figure 4); only the traceback to the invalid free is provided. In this case, the address of a stack variable was invalidly freed.
As mentioned earlier, Invalid free()/delete/delete[] messages are the first messages to investigate. An invalid free usually confuses the memory system so thoroughly (causing subtle and random problems from that point onward) that it is often pointless to continue debugging an application until all the invalid frees are fixed. A false positive with invalid free() messages is rare, so those messages should never be ignored.
Deciphering "Write of an Invalid Address" Messages
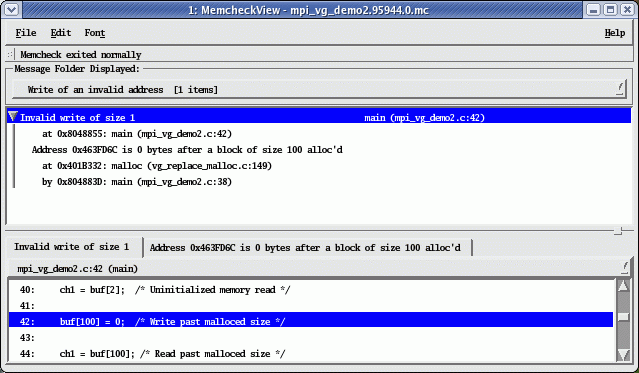
In Figure 6, Memcheck has detected an invalid write of size 1 (1 byte) at line 42 of mpi_vg_demo2.c. This invalid write was to an address one byte past the end of a malloced buffer allocated on line 38 of mpi_vg_demo2.c (vg_replace_malloc.c is Memcheck's instrumentation library and generally should be ignored in the call stack). In the message (top) pane, the arrow at the left of the Invalid write of size 1 message has been clicked so that all the call stack details for both the bad write and the closest allocated block are shown.
The source (bottom) pane shows the source code where the bad write occurred (Figure 6), with line 42 centered and highlighted. In order to display the source code for the allocation at line 38, click on the tab above the source pane labeled "Address 0x463FD6C is 0 bytes after a block of size 100 alloc'd" (which will show this source line centered and highlighted):
38: buf = (char *) malloc (100);
Click on the tab labeled "Invalid write of size 1" to see the source code where the write error occurred (i.e., make the GUI again look like Figure 6):
42: buf[100] = 0; /* Write past malloced size */
Invalid write messages (if any) are the Memcheck messages to investigate second, after resolving any invalid free and delete messages. Be aware that some compiler and library optimizations can cause invalid write and read warnings near the top of the stack by using unallocated stack space as temporary space (which you can ignore after verifying it is not caused by a code bug, such as passing a bad pointer to a library). However, false positives for invalid writes near allocated heap data (as is the case here) are rare.
Deciphering "Read of an Invalid Address" Messages
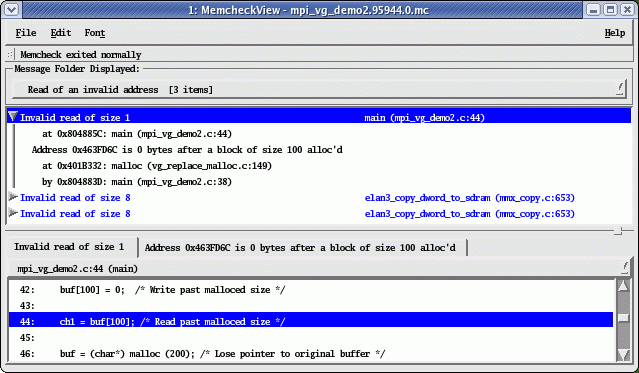
In Figure 7, Memcheck has detected an invalid read of size 1 (1 byte) at line 44 of mpi_vg_demo2.c. This invalid read was to an address one byte past the end of a malloced buffer allocated on line 38 of mpi_vg_demo2.c (vg_replace_malloc.c is Memcheck's instrumentation library and generally should be ignored in the call stack). In the message (top) pane, the arrow at the left of the Invalid read of size 1 message has been clicked so that all the call stack details for both the bad read and the closest allocated block are shown.
Invalid read messages (if any) are the Memcheck messages to investigate after free/delete of an invalid pointer and invalid write messages. Be aware that some compiler and library optimizations can cause invalid read and write warnings near the top of the stack by using unallocated stack space as temporary space (which you can ignore after verifying it is not caused by a code bug, such as passing a bad pointer to a library). However, false positives for invalid reads near to allocated heap data (as is the case here) are rare.
Examining Memcheck Messages Located in Library Calls and Navigating Call Stacks
It is very common for most of Memcheck's messages to indicate locations inside third-party libraries for which you don't have source to (e.g., system libraries, MPI libraries, graphics packages, commercial solvers, I/O libraries, etc.). Although it is highly recommended to focus on messages that indicate locations in your application's source first (because these tend to be the easier messages to understand), it is very important to also do at least a quick examination of all the issues not located in your application's source.
The goal of this quick examination is to determine if the parameters that your code passed to the library could be causing the problem or if there is simply no way it could be your code's fault. If an error in a library cannot possibly be your code's fault, simply ignore it for now and go on to the next Memcheck message; the goal is to find the problems in your code, not in the library (typically). If your code could be causing the problem via the parameters passed to the library call or how the library was initialized, it is worth examining the parameters of the library call to look for potential gotchas. (The problems can be quite subtle, like incorrect data type/size parameters or arguments of the same type in the wrong order.)
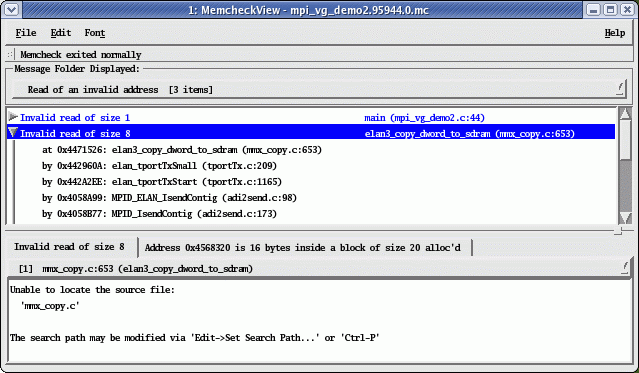
Figure 8 shows an open message (highlighted) for an invalid read of size 8 that is located deep within a library (an MPI elan3 library in this case). The rest of this section will describe the steps necessary to investigate this invalid read (including navigating call stacks with the GUI) and trace it back to an issue in the application code.
As shown in the message (top) pane of Figure 8, the invalid read occurred at line 653 of mmx_copy.c, which is not part of the application and for which we do not have source (as shown in the source pane). The invalid read actually occurred in part of the MPI library, which requires going up 10 levels in the call stack to find the call from the application's source code into the MPI library. The entire 10-level call stack can be seen either by scrolling/resizing the message window to see more of the message body or by using the "call stack trackback" Combo Box (described below).
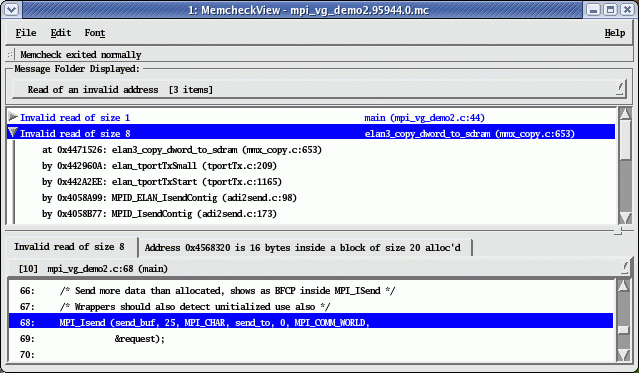
To see the source code where the application called the library, click on the call stack trackback Combo Box labeled "[1] mmx_copy.c:653..." underneath the source tab labeled "Invalid read of size 8" and the entire call stack traceback is shown (see Figure 9). The call stack traceback for levels [1] through [7] all clearly don't belong to the application (they are all part of the MPI library). Traceback levels [8] and [9] belong the Valgrind Memcheck MPI wrappers, which describes some of the semantics of MPI to Memcheck, greatly reducing false positives caused by high-performance MPI implementations and enhancing the memory checking. That leaves level [10], mpi_vg_demo2.c line 68 (in main), as the entry point to the library where the error occurred. Clicking on "[10] mpi_vg_demo2.c:68 (main)" selects that level in the call stack and displays the source code for that call.
Figure 10 shows the application's source code where MPI_Isend was called, after call stack level [10] was clicked in Figure 9's combo box. This MPI_Isend is the entry point into the MPI library that eventually leads to Memcheck detecting an issue in the elan3_copy_dword_to_sdram function.
It is now time to look at Memcheck's invalid read message in more detail. By either looking at the second source tab (labeled "Address 0x4568320 is 16 bytes inside a block of size 20 alloc'd") or scrolling down to see more of the message body, we can see that the invalid read of size 8 was to an address 16 bytes into an allocated block that was 20 bytes long. As mentioned in the "Deciphering 'Read of an Invalid Address' Messages" section, invalid reads that are near allocated blocks are rarely false positives. This particular 8-byte invalid read was located half in an allocated block and half outside an allocated block. Even though the MPI_Isend specifies character data (1 byte), MPI (and other) libraries often optimize data transfers by using 8-byte chunks; therefore, this issue can still be due to a parameter issue and requires examining the parameters further.
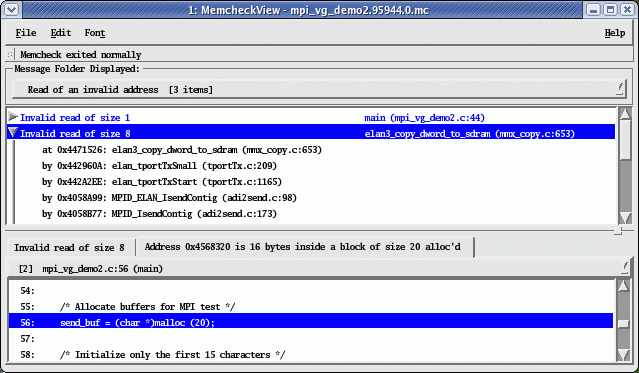
The MPI_Isend parameters (shown in Figure 10) indicate that 25 characters from send_buf should be sent to another process. By clicking on the source tab labeled "Address 0x4568320 is 16 bytes inside a block of size 20 alloc'd" we can see the source code where send_buf was allocated (see Figure 11) and that it is only 20 characters long. From these two source snippets, it is clear that because of the parameters to the MPI_Isend, the MPI_Isend is attempting to send more data from send_buf than was allocated. Even in more typical cases where all the parameters are variables (thus it is not immediately obvious when one is wrong), if one of the parameters points to an allocated buffer that is being overrun, it is likely that one of the parameters is causing the problem.
Deciphering "Conditional Jump or Move Depends on Uninitialized Value" Messages
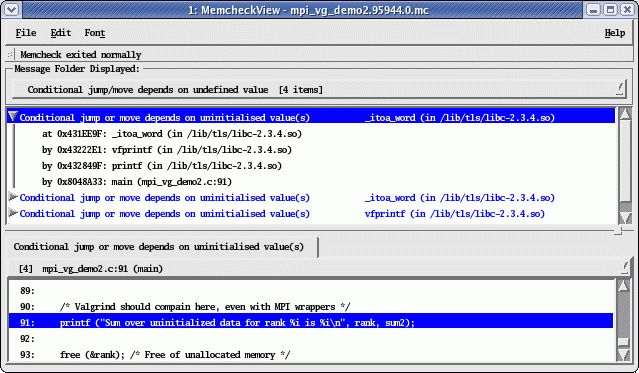
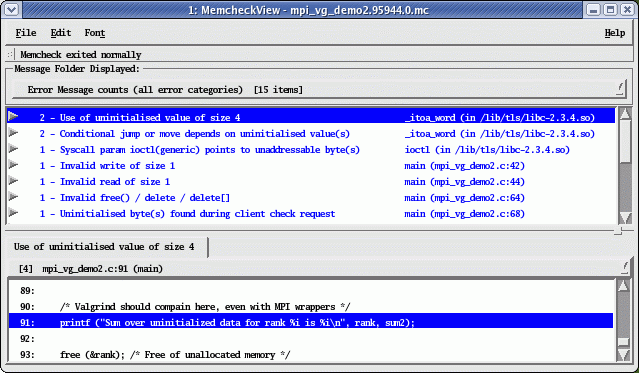
In Figure 12, Memcheck has detected the use of an uninitialized value several places within the c library caused by a call to printf on line 91.
Although the printf's "sum2" parameter appears to be clearly initialized just above the printf, Memcheck has actually detected a very subtle error in the application that effectively causes sum2 to be a semi-random value (i.e., not initialized). The relevant lines of source code for this error are:
68:    MPI_Isend (send_buf, 25, MPI_CHAR, send_to, 0, MPI_COMM_WORLD,
69:               &request);
70:
71:    /* Receive data sent above into bigger buffer */
72:    MPI_Recv (recv_buf, 30, MPI_CHAR, recv_from, 0, MPI_COMM_WORLD, &status);
       /*...*/
85:    /* Sum more data than was actually received */
86:    sum2 = 0;
87:    for (i=0; i < 30; i++)
88:        sum2 += recv_buf[i]; /* Last 5 bytes uninitialized */
89:
90:    /* Valgrind should complain here, even with MPI wrappers */
91:    printf ("Sum over uninitialized data for rank %i is %i\n", rank, sum2);
In the source code snippet above, it is clear that sum2 is initialized to 0 on line 86, so why did I indicate sum2 only appears to be initialized? The problem is that the last 5 characters in the recv_buf array are not initialized, and by adding these uninitialized values to sum2 on line 88, sum2 also becomes effectively uninitialized. Memcheck considers a variable to be uninitialized if any variable or memory location used in its calculation was uninitialized .
This problem is very hard to see because it appears that the MPI_Recv on line 72 should initialize the first 30 bytes of recv_buf. However, the MPI_Recv's "30" parameter is just the maximum size message that can be received, and, in this case, only 25 characters are actually sent on line 68 (from another process). Testing the "status" variable for the MPI_Recv would show that only 25 characters were actually received. This is a common gotcha in MPI programming, in part because example MPI programs rarely test the status of each MPI call.
So why did Memcheck wait until the printf to report a problem and not report the problem on line 88? Memcheck only generates a warning if you actually use an uninitialized value to make a decision (i.e., it affects a branch direction or the data selected by a conditional move instruction) in the program (thus the "conditional jump or move depends on uninitialized value(s)" message). In this case, several branches are used in the conversion of the integer parameter sum2 to a string deep within the printf in the _itoa_word() and vfprintf() functions (thus multiple messages). Memcheck doesn't report the access of uninitialized data on line 88 because there are many harmless cases where uninitialized data is loaded and manipulated by the program (often caused by compiler optimizations). This design decision by Memcheck significantly reduces uninitialized data false positives, but it often makes it harder to figure out why the warning was generated.
Tracking down the cause of uninitialized value messages can be very tricky and the cause often turns out to be relatively harmless. Therefore, I recommend focusing on uninitialized messages last. However, they are definitely worth looking at. Several critical and subtle bugs have been found by investigating these messages. Start with uninitialized value messages that are actually located in your program (versus a library) because they are typically easier to track down. If the uninitialized messages are in routines you don't pass parameters to (like MPI_Init or startup code before main), they are generally safe to ignore (because there is not much you can do to fix them).
Note: This MPI example requires the use of Valgrind Memcheck tool's MPI wrappers to get the proper results. (LLNL's installation of the memcheck_all script automatically uses these MPI wrappers.) Without Memcheck's MPI wrappers, the data received by MPI calls like MPI_Recv can look uninitialized to Memcheck, generating a huge number of false positives. These MPI wrappers were officially released June 2006 in Valgrind 3.2.0, and we are always looking for test cases showing improper MPI wrapping or an MPI function that was missed. Please contact John Gyllenhaal (gyllen@llnl.gov) if you have such a test case.
Client Check Requests and Memcheck's MPI wrappers
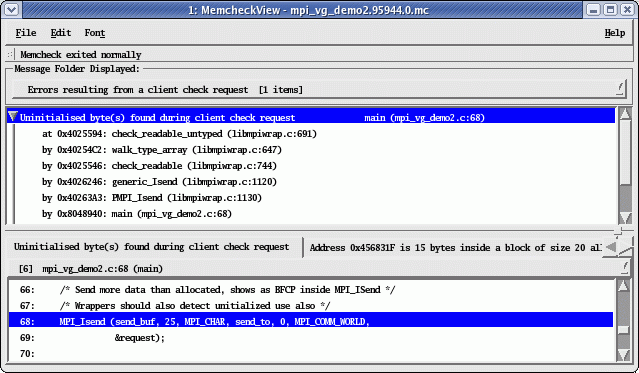
In Figure 13, Memcheck has detected (via a "client check request") the use of an uninitialized parameter (send_buf) passed to the MPI_Isend called on line 68. Client check requests are explicit checks inserted into the application by the programmer in order detect problems explicitly when Memcheck is run on the application. (Client check requests are a lot like assertions and do nothing when the program is not being run under Memcheck.) For information on how to explicitly insert client check requests into your application, see the Valgrind Memcheck documentation on client requests.
This particular client check request was inserted by using Memcheck's MPI wrappers that explicitly check that the data being sent via MPI is actually initialized. In this case, the client check request detected that only the first 15 bytes of "send_buf" is actually initialized, as shown in this source code snippet:
58:    /* Initialize only the first 15 characters */
59:    for (i=0; i < 15; i++)
60:       send_buf[i] = i;
       /*...*/
66:    /* Send more data than allocated, shows as BFCP inside MPI_ISend */
67:    /* Wrappers should also detect uninitialized use also */
68:    MPI_Isend (send_buf, 25, MPI_CHAR, send_to, 0, MPI_COMM_WORLD,
69:               &request);
LLNL's installation of the memcheck_all script automatically uses these MPI wrappers to more accurately check the data passed into MPI calls and annotate the data received from MPI calls as initialized. Without these Memcheck MPI wrappers, this error would have gone undetected with most of LLNL's MPI implementations. Please contact John Gyllenhaal (gyllen@llnl.gov) if you have an example or test case where the MPI wrappers do not appear to be working properly.
Which Memcheck Messages Are Safe to Ignore?
Most of the memory tools (including Memcheck) have reported potential problems in system libraries and other third-party libraries that really cannot be changed (and are unlikely to be serious problems since everyone uses them). In the cases where it is fairly clear your application could not have caused the problem (e.g., it happens before main or before your application really does anything), the best course of action is to just ignore those errors and focus on errors that your application could have caused. (Please see the "Examining Memcheck Messages Located in Library Calls..." section for more details on determining if invalid parameters are causing errors in library calls.) If you are feeling ambitious, you should only look in detail at messages your application could not have caused after you have resolved all the other issues in your application.
LLNL's installation of the memcheck and memcheck_all scripts uses an mpi_suppression file to attempt to hide most of these ignorable messages from you, especially those that occur in our MPI implementations. High-performance MPI implementations often do things with the memory in switch adapters that fool memory tools, causing Memcheck to report false positives (problems that don't really exist). This mpi_suppression file was generated by running small, trivially correct (e.g., hello world) MPI applications under Memcheck with --gen-suppressions=all. Each of these generated suppressions are then generalized by removing the traceback lines that refer to the test applications (so it will also mask ignorable warnings in other applications). Each new release of the MPI and system libraries generally requires the addition of new suppression directives, so it is not uncommon to get a few Memcheck messages you should ignore.
For example, in Figure 14 Memcheck has detected a problem within the call to MPI_Init, deep within the MPI Elan3 driver used at LLNL. This ioctl call is actually addressing memory in the MPI adapter, and Memcheck is just not aware of the MPI adapter's memory (so it is a false positive). Typically, any warning located in MPI_Init should be ignored unless you have intentionally modified the argc, argv arguments passed to MPI_Init.
Deciphering Error Message Counts
The Valgrind Memcheck tool attempts to prevent duplicate messages by only displaying one message per distinct location in your application. Memcheck roughly defines a distinct location as a particular instruction reach due to a unique set of four calls (i.e., a unique four deep call stack traceback). If the program exits normally (versus being killed by the batch system), Valgrind prints out how many times the instruction generating each message was executed (and hit the error) for each distinct location, as shown in Figure 15.
This message count display is not always useful because it is usually the category of the error, not the number of times it is reached, that indicates what warnings to look at first. However, these counts may give you insight into how many times your application exercised each suspected memory problem.
Deciphering "N Bytes in M Blocks Are Definitely Lost" Messages
When your application exits normally (not killed by the batch system, operating system, or user with an unmaskable signal), Memcheck examines all the unfreed memory blocks and emits a "definitely lost," "probably lost," or "still reachable" message for each block. Memcheck picks the message type for each unfreed block by scanning the application's memory, stack, registers, etc., looking for anything that could be interpreted as an address falling within the unfreed blocks.
Memcheck's "definitely lost" messages are used to report all the unfreed memory blocks where it is clear that all pointers to this memory block have been lost. MemcheckView files these messages under the category "memory leak". When looking for memory leaks, this is the category to look at first (of course, looking first at allocation in your own code). Unfreed memory blocks in this category are usually caused by overwriting a pointer variable without freeing the memory pointed at or by holding the pointer in a local variable (i.e., on the stack) and then not freeing it before returning from the function.
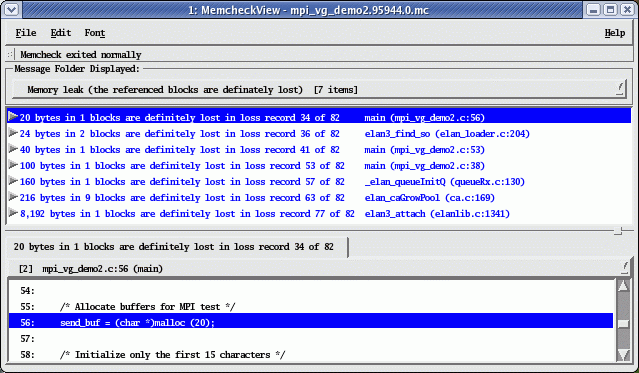
Figure 16 shows seven "definitely lost" blocks with the 20 bytes allocated on line 56 highlighted. The 'send_buf' pointer variable is a local variable, so the pointer to this block is lost when main() returns. Another 100 byte block allocated on line 38 was "definitely lost" because the pointer to it was overwritten on line 46, as shown in this source code snippet:
38:    buf = (char *) malloc (100);
       /*...*/
46:    buf = (char*) malloc (200); /* Lose pointer to original buffer */
Memcheck stores information about the allocation point for any unfreed blocks in a "loss record" (the "of 82" on each line indicate there were 82 loss records generated for this application). Only 7 of the loss records were classified to be a "definite memory leak." This is why the loss record IDs range from 34 to 77 in Figure 16, not 1 to 7.
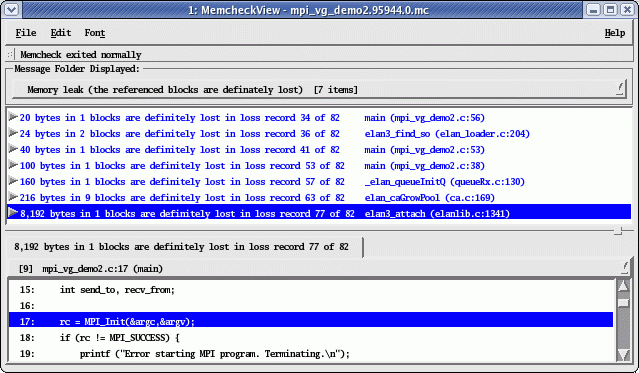
It is not uncommon to have definitely lost blocks in system and MPI libraries. Figure 17 shows that a block of 8192 bytes that MPI_Init allocated was definitely lost. As long as you have verified that your application has taken care of its responsibilities to free memory returned to it from the call, and has called teardown routines where appropriate (like MPI_Finalize for MPI applications), these memory leaks are typically safe to ignore.
Deciphering "N Bytes in M Blocks Are Possibly Lost" Messages
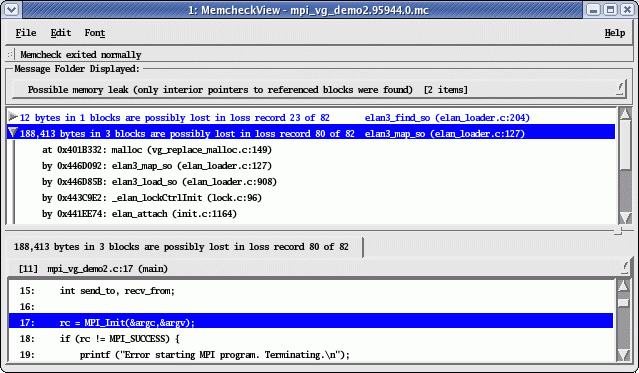
Memcheck's "possibly lost" messages (see Figure 18) are used to report all the unfreed memory blocks where it is probably true that all pointers to this memory block have been lost but if the application was doing something clever with this unfreed block's pointer (like holding only a pointer to the middle of a block instead of to the beginning), it is possible that a pointer to this unfreed memory could be reconstructed by the application (and thus it is not truly lost). MemcheckView files these messages under the category "possible memory leak." When looking for memory leaks, this is the category to look at second (of course, looking first at allocation in your own code). If your application is doing something clever with this unfreed block's pointer, treat this message like a "blocks are still reachable" message (discussed in the next section). Otherwise, treat it like a "blocks are definitely lost" message.
Deciphering "N Bytes in M Blocks Are Still Reachable" Messages
Memcheck's "blocks are still reachable" messages (see Figure 19) are used to report unfreed memory blocks that could (in theory) be freed at exit by the application because Memcheck has detected that the application still holds pointers to these block at exit. MemcheckView files these messages under the category "unfreed memory leak." When looking for memory leaks, this is the category to look at last, after definitely and potentially lost blocks. Although unfreed memory at exit is not aesthetically pleasing to some, there is nothing inherently wrong with unfreed memory at exit (as long as not freeing the memory is intentional).
In fact, for many applications, intentionally not freeing memory at exit is a sound design decision. All memory is instantly freed at exit automatically for the application by the operating system. For applications that have a significant number of allocated blocks that are used until exit is called, calling free on them can take a significant amount of time (minutes) and it is really wasted effort (because the exit would take care of it instantly). In addition, from a pragmatic point of view, freeing all your data before exit significantly increases the chance of exercising a non-critical bug after the application has "finished" but is just cleaning up.
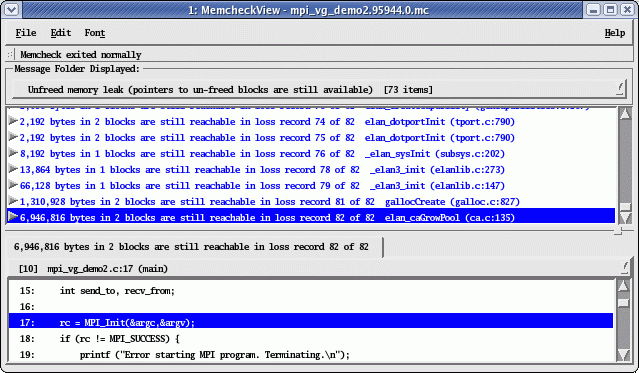
Figure 19 shows many unfreed memory blocks that were originally allocated in MPI_Init (a 6.9 MB block is highlighted). As long as you have verified that your application has taken care of its responsibilities to free memory returned to it from the call and has called teardown routines where appropriate (like MPI_Finalize for MPI applications), these unfreed memory blocks are typically safe to ignore.
Your focus first should be on unfreed blocks that can be freed well before the application exits. It is freeing these unfreed blocks that is most likely to reduce your total memory footprint while the application is running.
Need More Help?
Please contact John Gyllenhaal (via e-mail to gyllenhaal1@llnl.gov or telephone 925-424-5485) if you would like help using Valgrind's Memcheck tool or interpreting Memcheck's output (preferably generated on LLNL's computers), or if you are having problems with the MemcheckView GUI or the memcheck_all and memcheck helper scripts.
Documentation and References
- Valgrind Home Page: valgrind.org/
- Valgrind User Manual: valgrind.org/docs/manual/manual-intro.html


![Figure 9. Call traceback combobox shown open and user's code at level [10] clicked on. Figure 9. Call traceback combobox shown open and user's code at level [10] clicked on.](/sites/default/files/styles/no_sidebar_1_up/public/memcheckview_read2_traceback.gif?itok=LM2_AZd8)
