HPCToolkit is an integrated suite of tools for measurement and analysis of program performance on computers ranging from multicore desktop systems to the largest supercomputers. It uses low overhead statistical sampling of timers and hardware performance counters to collect accurate measurements of a program's work, resource consumption, and inefficiency and attributes them to the full calling context in which they occur.
HPCToolkit works with C/C++/Fortran applications that are either statically or dynamically linked. It supports measurement and analysis of serial codes, threaded codes (pthreads, OpenMP), MPI, and hybrid (MPI + threads) parallel codes.
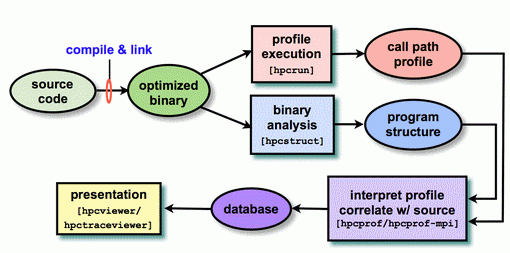
HPCToolkit's primary components and their relationships are described below:
- hpcrun: Collects accurate and precise calling-context-sensitive performance measurements for unmodified fully optimized applications at very low overhead (1-5%). It uses asynchronous sampling triggered by system timers and performance monitoring unit events to drive collection of call path profiles and optionally traces.
- hpcstruct: To associate calling-context-sensitive measurements with source code structure, hpcstruct analyzes fully optimized application binaries and recovers information about their relationship to source code. In particular, hpcstruct relates object code to source code files, procedures, loop nests, and identifies inlined code.
- hpcprof: Overlays call path profiles and traces with program structure computed by hpcstruct and correlates the result with source code. hpcprof/mpi handles thousands of profiles from a parallel execution by performing this correlation in parallel. hpcprof and hpcprof/mpi generate a performance database that can be explored using the hpcviewer and hpctraceviewer user interfaces.
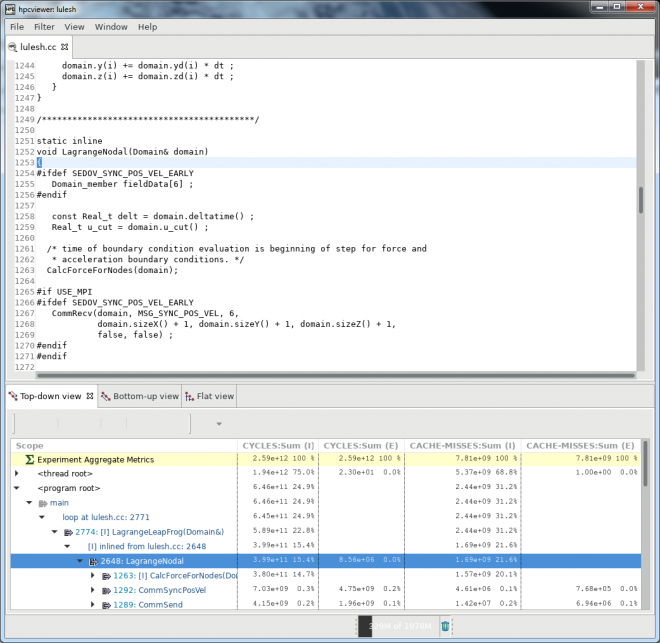
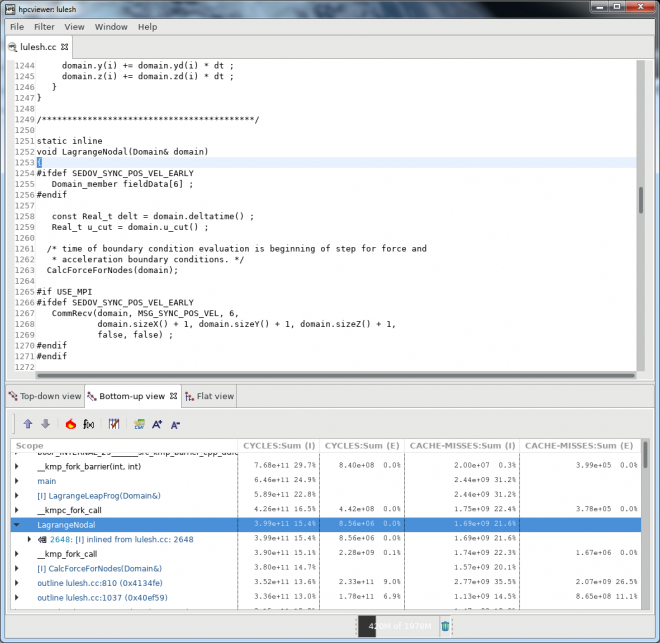
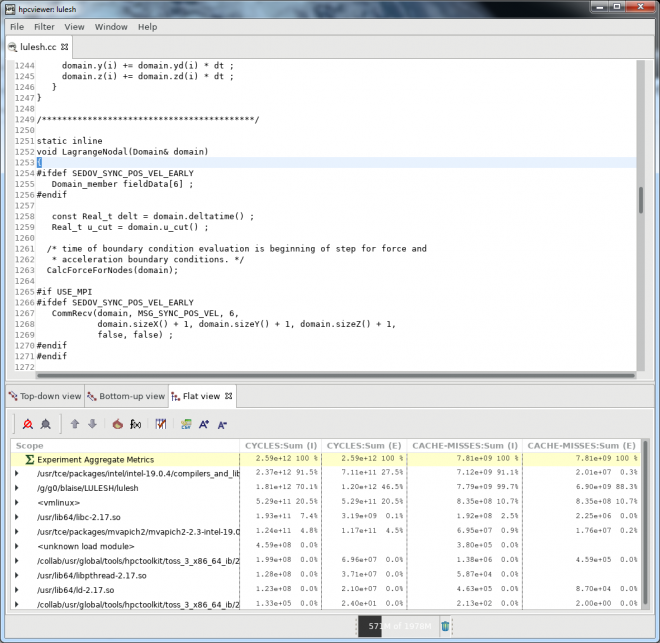
- hpcviewer: A graphical user interface that interactively presents performance data in three complementary code-centric views (top-down, bottom-up, and flat), as well as a graphical view that enables one to assess performance variability across threads and processes. hpcviewer is designed to facilitate rapid top-down analysis using derived metrics that highlight scalability losses and inefficiency rather than focusing exclusively on program hot spots.
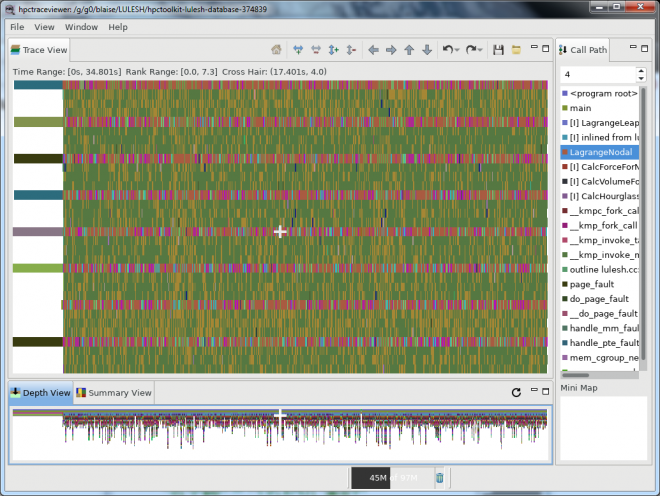
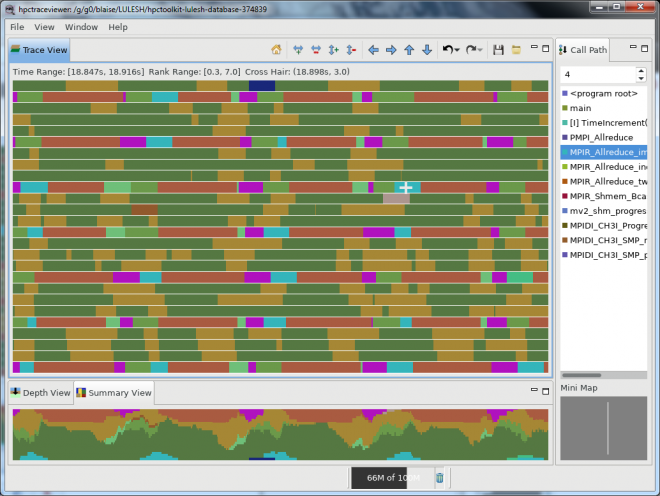
- hpctraceviewer: A graphical user interface that presents a hierarchical, time-centric view of a program execution. The tool can rapidly render graphical views of trace lines for thousands of processors for an execution tens of minutes long even a laptop. hpctraceviewer's hierarchical graphical presentation is quite different than that of other tools - it renders execution traces at multiple levels of abstraction by showing activity over time at different call stack depths.
Platforms and Locations
| Platform | Location | Notes |
|---|---|---|
| CORAL ppc64le |
/usr/global/tools/hpctoolkit | Multiple versions may be available. Use module commands to view and load. |
| Linux x86_64 TOSS 3 |
/usr/global/tools/hpctoolkit | Multiple versions may be available. Use module commands to view and load. |
Quick Start
Linux Systems & CORAL Systems
Using HPCToolkit involves following the workflow shown in the diagram below. Note that in the instructions that follow, only the steps for dynamically linked executables are shown. This is the default for LC's Linux systems. Statically linked applications follow a slightly different path - similar to that for BG/Q systems, in which executables are statically linked by default. See the HPCToolkit documentation for details.
1. First, determine which version of HPCToolkit you want to use, and then load that module package. For example:
% module avail hpctoolkit

---------------- /collab/usr/global/tools/modulefiles/toss_3_x86_64_ib/Core -----------------
   hpctoolkit/2019.02.26

Use "module spider" to find all possible modules.
Use "module keyword key1 key2 ..." to search for all possible modules matching
any of the "keys".

% module load hpctoolkit/2019.02.26
2. Compile your application using -g and full optimization. The optimization flag(s) will vary between compilers, but something like -O3 is typical.
% mpicc -g -O3 -o myapp myapp.c 3. Decide which events you want to sample. The available events can be listed with the hpcrun -L command. Note that these may differ between platforms, so be sure to run this first to see which events are valid for your platform. For example:
% hpcrun -L
===========================================================================
Available Timer events
===========================================================================
Name            Description
---------------------------------------------------------------------------
REALTIME        Real clock time used by the thread in microseconds.
                Based on the CLOCK_REALTIME timer with the SIGEV_THREAD_ID
                extension.  Includes time blocked in the kernel, but may
                not be available on all systems (eg, Blue Gene) and may
                break some syscalls that are sensitive to EINTR.

CPUTIME         CPU clock time used by the thread in microseconds.  Based
                on the CLOCK_THREAD_CPUTIME_ID timer with the SIGEV_THREAD_ID
                extension.  May not be available on all systems (eg, Blue Gene).

WALLCLOCK       CPU clock time used by the thread in microseconds.  Same
                as CPUTIME except on Blue Gene, where it is implemented
                by ITIMER_PROF.

Note: do not use multiple timer events in the same run.

===========================================================================
Available memory leak detection events
===========================================================================
Name            Description
---------------------------------------------------------------------------
MEMLEAK         The number of bytes allocated and freed per dynamic context

...
[ very long list truncated ]
4. Run your application under the HPCToolkit hpcrun command. For MPI jobs, you will need to run hpcrun under the appropriate MPI launch command. At LC, this is usually srun for Linux clusters and lrun (or jsrun) for CORAL systems. You will also need to specify the events (from above) and sampling period as arguments to the hpcrun command. For example:
LINUX:     % srun -n4 hpcrun -e CYCLES -e CACHE-MISSES myapp
CORAL:     % lrun -n4 hpcrun -e CYCLES -e CACHE-MISSES myapp
To include event tracing, simply add the -t option to the hpcrun command:
LINUX:     % srun -n4 hpcrun -t -e CYCLES -e CACHE-MISSES myapp
CORAL:     % lrun -n4 hpcrun -t -e CYCLES -e CACHE-MISSES myapp
Notes about the sampling period: The default is to sample events 300 times a second. Users can override this by using the event@howoften syntax, where howoften is either a number specifying the period (threshold) for that event, or f followed by a number, e.g., @f100 specifying a target sampling frequency for the event in samples/second. For example:
-e CACHE-MISSES@200000      interrupt application to generate a sample after 200000 CACHE-MISS events
-e CACHE-MISSES@f100        interrupt application to generate a sample 100 times/second for CACHE-MISS events
Note that a higher period implies a lower rate of sampling. It is recommended to select a period which results in no more than a couple hundred samples per second, since more frequent sampling will increase overhead. Finding the right period for an event may take several tries. See the user guide for additional information.
5. When your job completes, HPCToolkit will produce a measurements database that contains separate measurement information for each MPI rank and thread in the application. The database directory is named according the form:
hpctoolkit-myapp-measurements-jobid
Within the database directory, individual measurements files for each task/thread that are named using the template:
myapp-mpirank-threadid-hostid-processid-generationid.hpcrun
For example:
% ls hpctoolkit-myapp-measurements-1814406/
myapp-000000-000-a8c00170-56020-0.hpcrun  myapp-000002-000-a8c00170-56022-0.hpcrun
myapp-000000-000-a8c00170-56020-0.log     myapp-000002-000-a8c00170-56022-0.log
myapp-000001-000-a8c00170-56021-0.hpcrun  myapp-000003-000-a8c00170-56023-0.hpcrun
myapp-000001-000-a8c00170-56021-0.log     myapp-000003-000-a8c00170-56023-0.log
If you included tracing, there will also be a *.hpctrace file for each process/thread.
6. Generate an HPCToolkit program structure file for your application using the hpcstruct command:
% hpcstruct myappThe resulting file will be named myapp.hpcstruct. It will be used in the next step.
7. Generate an HPCToolkit performance database summary using the hpcprof command and specifying the hpcstruct file (previous step) and the name of your application's database directory. For example:
% hpcprof -S myapp.hpcstruct hpctoolkit-myapp-measurements-1814406The resulting database summary, in this case, will be contained in a directory named hpctoolkit-myapp-database-1814406.
8. Use the hpcviewer utility to interactively view and analyze the HPCToolkit performance database:
% hpcviewer hpctoolkit-myapp-database-1814406To view/analyze tracefile data, use the hpctraceviewer utility:
% hpctraceviewer hpctoolkit-myapp-database-1814406ls -l Several examples of hpcviewer and hpctraceviewer are shown in the Output section below.
Output
HPCToolkit will produce one or more measurements output files for each process/thread, depending upon the run-time options used. These files are written to the hpctoolkit-myapp-measurements-jobid directory. Further processing by the hpcstruct and hpcprof commands results in performance database files written to the hpctoolkit-myapp-database-jobid directory.
The hpcviewer and hpctraceviewer utilities use the performance database directory files to graphically view and analyze an application's behavior. Examples of both utilities are shown below, however users will want to consult the HPCToolkit documentation for details.
Important note: As of 5/15, LC has not built/installed the hpcviewer and hpctraceviewer utilities for BG/Q. However, you can use the ones built/installed on Linux systems to view BG/Q produced output files.
Compiling and Linking
Compiling: applications should be compiled with the -g flag plus full optimization. Optimization flags differ between compilers, but something like -O3 is typical.
Linking: for dynamically linked applications, no special HPCToolkit linking instructions are required. However, statically linked applications will need to use the HPCToolkit hpclink command as part of their application build process. This is described in the HPCToolkit User Manual.
Run-time Options
Each of the commands used in the HPCToolkit workflow path have run-time options associated with them. The HPCToolkit documentation, specifically the User's Manual and Man Pages, cover the details.
Troubleshooting
- HPCToolkit is a complex toolkit, and as such, troubleshooting problems may be difficult for the average user.
- The most common problem at LC is probably forgetting to load the HPCToolkit environment using the Dotkit use command.
- Statically linked applications need to follow a different workflow path, covered in the HPCToolkit documentation and under BG/Q systems above.
- Most problems, if not easily resolved, should be reported to the LC Hotline.
Documentation and References
- HPCToolkit webpage: https://hpctoolkit.gitlab.io/hpctoolkit/


