TAU (Tuning and Analysis Utilities) is a comprehensive profiling and tracing toolkit for performance analysis of parallel programs written in Fortran, C, C++, Java, and Python. It is capable of gathering performance information through instrumentation of functions, methods, basic blocks, and statements. All C++ language features are supported including templates and namespaces. The instrumentation consists of calls to TAU library routines, which can be incorporated into a program in several ways:
- Automatic instrumentation using the compiler
- Automatic instrumentation using the Program Database Toolkit (PDT)
- Manual instrumentation using the instrumentation API
- At runtime using library call interception through the tau_exec command
- Dynamically using DyninstAPI
- At runtime in the Java virtual machine
Data Analysis and Visualization:
- Profile data: TAU's profile visualization tool, ParaProf, provides a variety of graphical displays for profile data to help users quickly identify sources of performance bottlenecks. The text based pprof tool is also available for analyzing profile data.
- Trace data: TAU provides the JumpShot trace visualization tool for graphical viewing of trace data. TAU also provide utilities to convert trace data into formats for viewing with Vampir, Paraver, and other performance analysis tools.
Programming models and platforms: TAU supports most commonly used parallel hardware and programming models, including Intel, Cray, IBM, Sun, Apple, SGI, GPUs/Accelerators, HP, NEC, Fujitsu, MS Windows, using MPI, OpenMP, Pthreads, OpenCL, CUDA, and Hybrid.
Platforms and Locations
| Platform | Location | Notes |
|---|---|---|
| x86_64 Linux | /usr/global/tools/tau/ | Load the module: module load tau |
| CORAL | /usr/global/tools/tau/ | Load the module: module load tau |
Quick Start
TAU is a sophisticated, full-featured toolkit. Only a subset of TAU's features, at a "very basics" level, are discussed below. Users will need to consult the TAU documentation to learn more.
1. Profiling
The easiest and quickest way to profile an application is to use the tau_exec command. It automatically instruments your executable at run time, and requires no special compilation or modifications to source code. All you need to do is make sure your TAU environment is setup correctly.
1. Setup your TAU environment by loading the TAU module. Also, just to be sure, set the TAU_PROFILE environment variable to "1". Optionally, you can specify where the profile files are written (default is working directory).
% module load tau
% setenv TAU_PROFILE 1
% setenv PROFILEDIR  /p/lscratche/joesmith/matmultProfiles
% mkdir -p $PROFILEDIR
2. Run your program using the tau_exec command. For example, launching a 64 task MPI job in the pdebug partition:
% srun -n64 -ppdebug tau_exec matmult
3. Following completion of your job, you will have a set of files named profile.#.* where # denotes the MPI rank. Viewing these files is discussed in the Output section below.
Another way to automatically instrument your application is to use the TAU Makefile scripts. This is slightly more work, but is required for profiling some parameters, such as hardware counter (PAPI) events.
1. Setup your TAU environment by loading the TAU module. Also, just to be sure, set the TAU_PROFILE environment variable to "1". Optionally, you can specify where the profile files are written (default is working directory).
% module load tau
% setenv TAU_PROFILE 1
% setenv PROFILEDIR  /p/lscratche/joesmith/matmultProfiles
% mkdir -p $PROFILEDIR
2. Determine the path of the TAU libraries you've loaded. An easy way to do this is shown below:
% module show tau |& grep LIBRARY
prepend_path("LD_LIBRARY_PATH","/usr/global/tools/tau/training/tau-2.29/x86_64/lib")
3. Using the TAU library path from above, select the appropriate TAU Makefile for what you want to profile. They are named according to what they instrument. For example:
% ls /usr/local/tools/tau-2.21.1/x86_64/lib/Makefile*
/usr/global/tools/tau/training/tau-2.29/x86_64/lib/Makefile.tau-icpc-ompt-v5-pdt-openmp
/usr/global/tools/tau/training/tau-2.29/x86_64/lib/Makefile.tau-icpc-papi-mpi-pthread-pdt
/usr/global/tools/tau/training/tau-2.29/x86_64/lib/Makefile.tau-icpc-papi-ompt-v5-mpi-pdt-openmp
/usr/global/tools/tau/training/tau-2.29/x86_64/lib/Makefile.tau-icpc-papi-ompt-v5-pdt-openmp
4. Set TAU_MAKEFILE to the full pathname of the Makefile you choose. This example uses the Intel compiler to profile MPI and PAPI:
% setenv TAU_MAKEFILE /usr/global/tools/tau/training/tau-2.29/x86_64/lib/Makefile.tau-icpc-papi-mpi-pthread-pdt
5. Compile your application using the appropriate TAU compiler wrapper script. These are located in the /bin directory of the TAU package you loaded, and should be in your path. The choices are shown in the table below. Note that if you are using makefiles, you will need to substitute these wrapper scripts accordingly.
| Language | TAU Compiler Wrapper |
|---|---|
| C | tau_cc.sh |
| C++ | tau_cxx.sh |
| Fortran77 | tau_f77.sh |
| Fortran90 | tau_f90.sh |
For example, compiling a simple C program:
% tau_cc.sh -O3 -g -o matmult matmult.c
Note that compiler options will get passed to the native compiler of your choice. Also note that TAU provides a number of its own compiler options, not discussed here. For details, see TAU Compiler Options.
6. Run your TAU instrumented executable as usual. For example, launching a 64 task MPI job in the pdebug partition:
% srun -n64 -ppdebug matmult
7. Following completion of your job, you will have a set of files named profile.#.* where # denotes the MPI rank. Viewing these files is discussed in the Output section below.
2. Tracing
TAU can be used to trace events during a program's execution. Unlike profiling, which aggregates the time spent in each routine, loop, etc. tracing allows you to view events as they relate to each other against a timeline. One caveat about tracing however, is that trace files can quickly grow to be very large, which makes tracing difficult or impossible for long running, many process jobs.
As with profiling, the easiest and quickest way to trace an application is to use the tau_exec command. It automatically instruments your executable at run time, and requires no special compilation or modifications to source code. All you need to do is make sure your TAU environment is setup correctly.
1. Setup your TAU environment by loading the TAU module. Also, make sure the TAU_TRACE environment variable is set to "1". If you want to specify a directory where the tracefiles should be written (default is the working directory), use the TRACEDIR environment variable.
% module load tau
% setenv TAU_TRACE 1
% setenv TRACEDIR /p/lscratche/joesmith/matmultTracefiles
% mkdir -p $TRACEDIR
Note: If you want to include TAU profiling at the same time as tracing, set the TAU_PROFILE environment variable to "1". By default, it is turned off when tracing.
2. Run your program using the tau_exec command. For example, launching a 64 task MPI job in the pdebug partition:
% srun -n64 -ppdebug tau_exec matmult
3. Following completion of your job, you will have a two sets of files named tautrace.#.*.trc and events.#.edf where # denotes the MPI rank. Viewing these files is discussed in the Output section below.
As with profiling, you can automatically instrument your application for tracing by using the TAU makefile scripts, as an alternative to using the tau_exec command.
1. First, setup your TAU environment by loading the TAU module. Also, make sure the TAU_TRACE environment variable is set to "1". If you want to specify a directory where the tracefiles should be written (default is the working directory), use the TRACEDIR environment variable.
% module load tau
% setenv TAU_TRACE 1
% setenv TRACEDIR /p/lscratche/joesmith/matmultTracefiles
% mkdir -p $TRACEDIR
2. Then, follow steps 2 through 6 above under Profiling.
3. Following completion of your job, you will have a two sets of files named tautrace.#.*.trc and events.#.edf where # denotes the MPI rank. Viewing these files is discussed in the Output section below.
3. PAPI Hardware Counters
TAU can be used to record hardware events through PAPI hardware counters. This is actually a type of profiling, so the instructions are very similar to those for Profiling above.
1. Follow steps 1 through 5 under Profiling using TAU Makefiles to build an instrumented executable.
2. Determine which PAPI events are available on the platform you are using with the papi_avail command:
% papi_avail
Available events and hardware information.
--------------------------------------------------------------------------------
PAPI Version             : 5.2.0.0
Vendor string and code   : GenuineIntel (1)
Model string and code    : Intel(R) Xeon(R) CPU E5-2695 v4 @ 2.10GHz (79)
CPU Revision             : 1.000000
CPUID Info               : Family: 6  Model: 79  Stepping: 1
CPU Max Megahertz        : 2101
CPU Min Megahertz        : 1200
Hdw Threads per core     : 1
Cores per Socket         : 18
Sockets                  : 4
NUMA Nodes               : 2
CPUs per Node            : 36
Total CPUs               : 72
Running in a VM          : no
Number Hardware Counters : 11
Max Multiplex Counters   : 64
--------------------------------------------------------------------------------

    Name        Code    Avail Deriv Description (Note)
PAPI_L1_DCM  0x80000000  Yes   No   Level 1 data cache misses
PAPI_L1_ICM  0x80000001  Yes   No   Level 1 instruction cache misses
PAPI_L2_DCM  0x80000002  Yes   Yes  Level 2 data cache misses
PAPI_L2_ICM  0x80000003  Yes   No   Level 2 instruction cache misses
PAPI_L3_DCM  0x80000004  No    No   Level 3 data cache misses
PAPI_L3_ICM  0x80000005  No    No   Level 3 instruction cache misses
PAPI_L1_TCM  0x80000006  Yes   Yes  Level 1 cache misses
PAPI_L2_TCM  0x80000007  Yes   No   Level 2 cache misses
PAPI_L3_TCM  0x80000008  Yes   No   Level 3 cache misses
PAPI_CA_SNP  0x80000009  Yes   No   Requests for a snoop
PAPI_CA_SHR  0x8000000a  Yes   No   Requests for exclusive access to shared cache line
PAPI_CA_CLN  0x8000000b  Yes   No   Requests for exclusive access to clean cache line
PAPI_CA_INV  0x8000000c  Yes   No   Requests for cache line invalidation
PAPI_CA_ITV  0x8000000d  Yes   No   Requests for cache line intervention
PAPI_L3_LDM  0x8000000e  Yes   No   Level 3 load misses
PAPI_L3_STM  0x8000000f  No    No   Level 3 store misses
PAPI_BRU_IDL 0x80000010  No    No   Cycles branch units are idle
PAPI_FXU_IDL 0x80000011  No    No   Cycles integer units are idle
PAPI_FPU_IDL 0x80000012  No    No   Cycles floating point units are idle
PAPI_LSU_IDL 0x80000013  No    No   Cycles load/store units are idle
PAPI_TLB_DM  0x80000014  Yes   Yes  Data translation lookaside buffer misses
PAPI_TLB_IM  0x80000015  Yes   No   Instruction translation lookaside buffer misses
PAPI_TLB_TL  0x80000016  No    No   Total translation lookaside buffer misses
PAPI_L1_LDM  0x80000017  Yes   No   Level 1 load misses
PAPI_L1_STM  0x80000018  Yes   No   Level 1 store misses
PAPI_L2_LDM  0x80000019  Yes   No   Level 2 load misses
PAPI_L2_STM  0x8000001a  Yes   No   Level 2 store misses
PAPI_BTAC_M  0x8000001b  No    No   Branch target address cache misses
PAPI_PRF_DM  0x8000001c  Yes   No   Data prefetch cache misses
PAPI_L3_DCH  0x8000001d  No    No   Level 3 data cache hits
PAPI_TLB_SD  0x8000001e  No    No   Translation lookaside buffer shootdowns
PAPI_CSR_FAL 0x8000001f  No    No   Failed store conditional instructions
PAPI_CSR_SUC 0x80000020  No    No   Successful store conditional instructions
PAPI_CSR_TOT 0x80000021  No    No   Total store conditional instructions
PAPI_MEM_SCY 0x80000022  No    No   Cycles Stalled Waiting for memory accesses
PAPI_MEM_RCY 0x80000023  No    No   Cycles Stalled Waiting for memory Reads
PAPI_MEM_WCY 0x80000024  Yes   No   Cycles Stalled Waiting for memory writes
PAPI_STL_ICY 0x80000025  Yes   No   Cycles with no instruction issue
PAPI_FUL_ICY 0x80000026  Yes   Yes  Cycles with maximum instruction issue
PAPI_STL_CCY 0x80000027  Yes   No   Cycles with no instructions completed
PAPI_FUL_CCY 0x80000028  Yes   No   Cycles with maximum instructions completed
PAPI_HW_INT  0x80000029  No    No   Hardware interrupts
PAPI_BR_UCN  0x8000002a  Yes   Yes  Unconditional branch instructions
PAPI_BR_CN   0x8000002b  Yes   No   Conditional branch instructions
PAPI_BR_TKN  0x8000002c  Yes   Yes  Conditional branch instructions taken
PAPI_BR_NTK  0x8000002d  Yes   No   Conditional branch instructions not taken
PAPI_BR_MSP  0x8000002e  Yes   No   Conditional branch instructions mispredicted
PAPI_BR_PRC  0x8000002f  Yes   Yes  Conditional branch instructions correctly predicted
PAPI_FMA_INS 0x80000030  No    No   FMA instructions completed
PAPI_TOT_IIS 0x80000031  No    No   Instructions issued
PAPI_TOT_INS 0x80000032  Yes   No   Instructions completed
PAPI_INT_INS 0x80000033  No    No   Integer instructions
PAPI_FP_INS  0x80000034  No    No   Floating point instructions
PAPI_LD_INS  0x80000035  Yes   No   Load instructions
PAPI_SR_INS  0x80000036  Yes   No   Store instructions
PAPI_BR_INS  0x80000037  Yes   No   Branch instructions
PAPI_VEC_INS 0x80000038  No    No   Vector/SIMD instructions (could include integer)
PAPI_RES_STL 0x80000039  Yes   No   Cycles stalled on any resource
PAPI_FP_STAL 0x8000003a  No    No   Cycles the FP unit(s) are stalled
PAPI_TOT_CYC 0x8000003b  Yes   No   Total cycles
PAPI_LST_INS 0x8000003c  Yes   Yes  Load/store instructions completed
PAPI_SYC_INS 0x8000003d  No    No   Synchronization instructions completed
PAPI_L1_DCH  0x8000003e  No    No   Level 1 data cache hits
PAPI_L2_DCH  0x8000003f  No    No   Level 2 data cache hits
PAPI_L1_DCA  0x80000040  No    No   Level 1 data cache accesses
PAPI_L2_DCA  0x80000041  Yes   No   Level 2 data cache accesses
PAPI_L3_DCA  0x80000042  Yes   Yes  Level 3 data cache accesses
PAPI_L1_DCR  0x80000043  No    No   Level 1 data cache reads
PAPI_L2_DCR  0x80000044  Yes   No   Level 2 data cache reads
PAPI_L3_DCR  0x80000045  Yes   No   Level 3 data cache reads
PAPI_L1_DCW  0x80000046  No    No   Level 1 data cache writes
PAPI_L2_DCW  0x80000047  Yes   No   Level 2 data cache writes
PAPI_L3_DCW  0x80000048  Yes   No   Level 3 data cache writes
PAPI_L1_ICH  0x80000049  No    No   Level 1 instruction cache hits
PAPI_L2_ICH  0x8000004a  Yes   No   Level 2 instruction cache hits
PAPI_L3_ICH  0x8000004b  No    No   Level 3 instruction cache hits
PAPI_L1_ICA  0x8000004c  No    No   Level 1 instruction cache accesses
PAPI_L2_ICA  0x8000004d  Yes   No   Level 2 instruction cache accesses
PAPI_L3_ICA  0x8000004e  Yes   No   Level 3 instruction cache accesses
PAPI_L1_ICR  0x8000004f  No    No   Level 1 instruction cache reads
PAPI_L2_ICR  0x80000050  Yes   No   Level 2 instruction cache reads
PAPI_L3_ICR  0x80000051  Yes   No   Level 3 instruction cache reads
PAPI_L1_ICW  0x80000052  No    No   Level 1 instruction cache writes
PAPI_L2_ICW  0x80000053  No    No   Level 2 instruction cache writes
PAPI_L3_ICW  0x80000054  No    No   Level 3 instruction cache writes
PAPI_L1_TCH  0x80000055  No    No   Level 1 total cache hits
PAPI_L2_TCH  0x80000056  No    No   Level 2 total cache hits
PAPI_L3_TCH  0x80000057  No    No   Level 3 total cache hits
PAPI_L1_TCA  0x80000058  No    No   Level 1 total cache accesses
PAPI_L2_TCA  0x80000059  Yes   Yes  Level 2 total cache accesses
PAPI_L3_TCA  0x8000005a  Yes   No   Level 3 total cache accesses
PAPI_L1_TCR  0x8000005b  No    No   Level 1 total cache reads
PAPI_L2_TCR  0x8000005c  Yes   Yes  Level 2 total cache reads
PAPI_L3_TCR  0x8000005d  Yes   Yes  Level 3 total cache reads
PAPI_L1_TCW  0x8000005e  No    No   Level 1 total cache writes
PAPI_L2_TCW  0x8000005f  Yes   No   Level 2 total cache writes
PAPI_L3_TCW  0x80000060  Yes   No   Level 3 total cache writes
PAPI_FML_INS 0x80000061  No    No   Floating point multiply instructions
PAPI_FAD_INS 0x80000062  No    No   Floating point add instructions
PAPI_FDV_INS 0x80000063  No    No   Floating point divide instructions
PAPI_FSQ_INS 0x80000064  No    No   Floating point square root instructions
PAPI_FNV_INS 0x80000065  No    No   Floating point inverse instructions
PAPI_FP_OPS  0x80000066  No    No   Floating point operations
PAPI_SP_OPS  0x80000067  Yes   Yes  Floating point operations; optimized to count scaled single precision vector operations
PAPI_DP_OPS  0x80000068  Yes   Yes  Floating point operations; optimized to count scaled double precision vector operations
PAPI_VEC_SP  0x80000069  Yes   Yes  Single precision vector/SIMD instructions
PAPI_VEC_DP  0x8000006a  Yes   Yes  Double precision vector/SIMD instructions
PAPI_REF_CYC 0x8000006b  Yes   No   Reference clock cycles
-------------------------------------------------------------------------
Of 108 possible events, 60 are available, of which 16 are derived.

avail.c                                     PASSED
3. There are many counters available, but in practice, you can usually only use a few at a time, because not all events can be counted together. Decide which events you want to count, and then find out if they are compatible or not with the papi_event_chooser command. The example below shows an incompatibility.
% papi_event_chooser PAPI_LD_INS PAPI_SR_INS PAPI_L1_DCM PAPI_L1_ICH
 PAPI_L1_ICH
Event Chooser: Available events which can be added with given events.
--------------------------------------------------------------------------------
PAPI Version             : 5.2.0.0
Vendor string and code   : GenuineIntel (1)
Model string and code    : Intel(R) Xeon(R) CPU E5-2695 v4 @ 2.10GHz (79)
CPU Revision             : 1.000000
CPUID Info               : Family: 6  Model: 79  Stepping: 1
CPU Max Megahertz        : 2101
CPU Min Megahertz        : 1200
Hdw Threads per core     : 1
Cores per Socket         : 18
Sockets                  : 4
NUMA Nodes               : 2
CPUs per Node            : 36
Total CPUs               : 72
Running in a VM          : no
Number Hardware Counters : 11
Max Multiplex Counters   : 64
--------------------------------------------------------------------------------

Event PAPI_L1_ICH can't be counted with others -7
4. Set the COUNTER environment variables for compatible events of interest. It is recommended (or required) to set COUNTER1 to an available timer, such as GET_TIME_OF_DAY. For example:
% setenv COUNTER1 GET_TIME_OF_DAY
% setenv COUNTER2 PAPI_L1_DCM
% setenv COUNTER3 PAPI_L1_ICM
% setenv COUNTER4 PAPI_L2_DCM
% setenv COUNTER5 PAPI_L2_ICM
5. Run your application as usual. Following execution, you will have a unique directory for each PAPI event. Inside each directory, there will be a set of files named profile.#.* where # denotes the MPI rank. Viewing these files is discussed in the Output section below.
% ls
MULTI__GET_TIME_OF_DAY  MULTI__PAPI_L2_DCM  matmult.f90
MULTI__PAPI_L1_DCM      MULTI__PAPI_L2_ICM  matmult.o
MULTI__PAPI_L1_ICM      Makefile            matmult
% ls MULTI__PAPI_L1_DCM
profile.0.0.0  profile.2.0.0  profile.4.0.0  profile.6.0.0
profile.1.0.0  profile.3.0.0  profile.5.0.0  profile.7.0.0
Note: you can perform tracing at the same time as recording PAPI events by setting the TAU_TRACE environment variable to "1". You cannot, however perform normal TAU profiling at the same time as PAPI.
4. Selective and Manual Instrumentation
TAU provides the ability for users to customize their application's instrumentation, thereby enabling them to focus on specific areas of interest, and reduce run-time overhead associated with profiling the entire application. There are two ways to do this, as discussed below.
Selective Instrumentation
1. Create a text file that contains the names of routines and/or source files that should be instrumented or not instrumented. The type of instrumentation can also be specified: loops, memory, I/O, etc.
2. Build your instrumented executable, following steps 1 through 5 under Profiling with TAU Makefiles above, and be sure to do the following:
- Use a TAU Makefile that includes -pdt in its name
- Include the TAU compiler wrapper script option -optTauSelectFile=filename, where filename is the name of your selective instrumentation text file.
For additional details, including the required syntax for the selective instrumentation text file, see the TAU documentation at www.cs.uoregon.edu/research/tau/docs/newguide/bk01ch01s03.html
Manual Instrumentation
The TAU Instrumentation API provides a means for users to place TAU routines in their source code to explicitly direct how TAU should instrument their application. There are over 125 routines available. For details, see the TAU documentation at www.cs.uoregon.edu/research/tau/docs/newguide/bk03rn01.html.
Output
1. Profiling
TAU profiling output consists of a set of files named profile.X.Y.Z where:
X = MPI rank number
Y = context
Z = thread number
pprof
To get a quick, text based summary of your job's profile data, the TAU pprof utility can be used. By default, it will process all of the profile.* files in the current directory and produce a report showing profile data for each rank/context/thread. An example for one MPI rank is shown below:
% module load tau
% pprof
NODE 1;CONTEXT 0;THREAD 0:
-----------------------------------------------------------------------
%Time    Exclusive    Inclusive       #Call      #Subrs  Inclusive Name
              msec   total msec                          usec/call
-----------------------------------------------------------------------
100.0            5        4,489           1           1    4489358 .TAU application
99.9            5        4,484           1        4432    4484326 main
61.9        2,778        2,778         461           0       6028 multiply_matrices
32.8        1,472        1,473           1          44    1473099 MPI_Init()
  2.8          126          126        3010           0         42 MPI_Bcast()
  1.7           77           77         462           0        168 MPI_Recv()
  0.3           11           11         461           0         25 MPI_Send()
  0.3           11           11           1          48      11425 MPI_Finalize()
  0.0        0.171        0.171           5           0         34 MPI_Allgather()
  0.0        0.067         0.07           5          15         14 MPI_Comm_split()
  0.0        0.053        0.058          10          21          6 MPI_Comm_create()
  0.0        0.052        0.052          10           0          5 MPI_Allreduce()
  0.0        0.016        0.016          52           0          0 MPI_Errhandler_set()
  0.0         0.01         0.01          10           0          1 MPI_Group_incl()
  0.0        0.009        0.009          12           0          1 MPI_Comm_free()
  0.0        0.008        0.008           6           0          1 MPI_Type_contiguous()
  0.0        0.006        0.006          15           0          0 MPI_Group_free()
  0.0        0.004        0.004           4           0          1 MPI_Attr_put()
  0.0        0.004        0.004           5           0          1 MPI_Type_struct()
  0.0        0.003        0.003          13           0          0 MPI_Comm_rank()
  0.0        0.003        0.003          11           0          0 MPI_Type_commit()
  0.0        0.001        0.001           5           0          0 MPI_Comm_group()
  0.0            0            0           1           0          0 MPI_Comm_size()
-----------------------------------------------------------------------

USER EVENTS Profile :NODE 1, CONTEXT 0, THREAD 0
-----------------------------------------------------------------------
NumSamples   MaxValue   MinValue  MeanValue  Std. Dev.  Event Name
-----------------------------------------------------------------------
         5          4          4          4          0  Message size for all-gather
        10          4          4          4          0  Message size for all-reduce
      3010    2.4E+04          4  2.392E+04       1381  Message size for broadcast
       462    2.4E+04          8  2.395E+04       1115  Message size received from all nodes
       461    2.4E+04    2.4E+04    2.4E+04          0  Message size sent to all nodes
-----------------------------------------------------------------------
ParaProf
ParaProf is TAU's graphical profile analysis utility. To use ParaProf:
1. Go to the directory containing the profile.* files.
2. If you have not already done so, load the TAU environment and then issue the paraprof command:
% module load tau
% paraprof
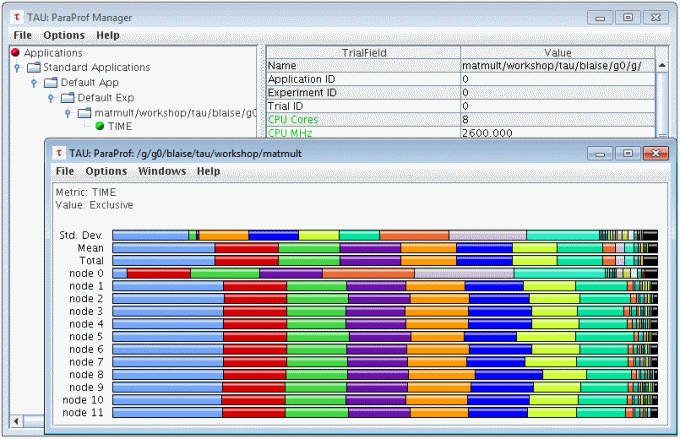
3. A manager window and profile summary window will appear. Left/right clicking on items in the summary window allows you to view different types of information, as do the various menu selections.
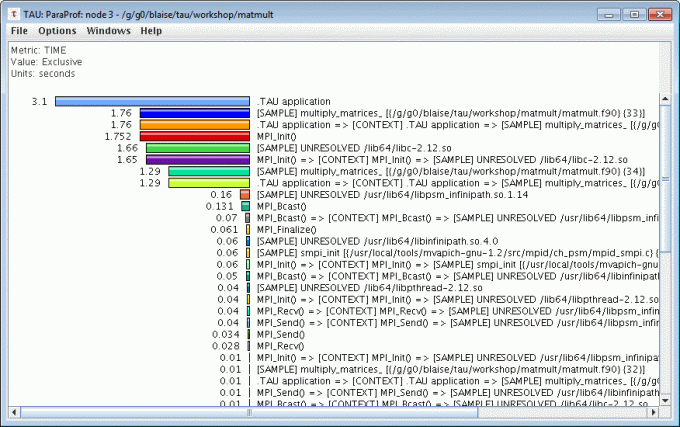
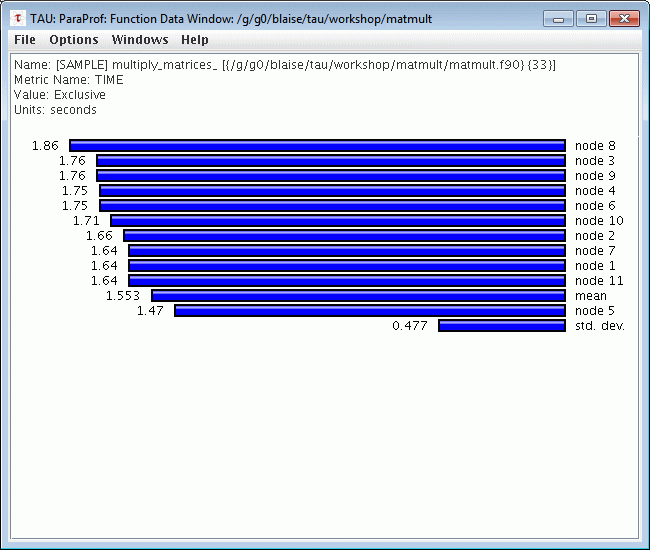
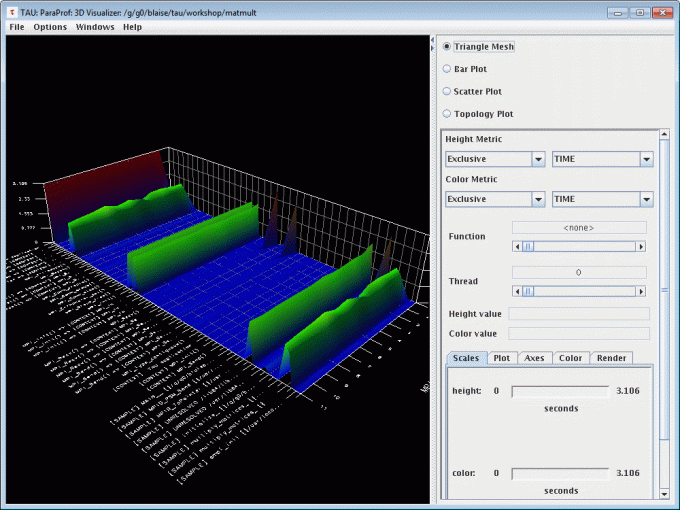
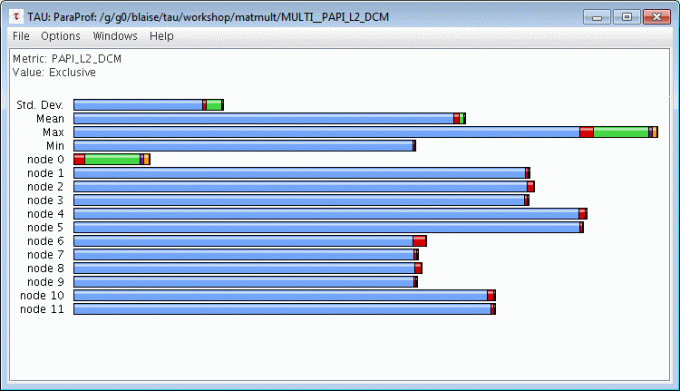
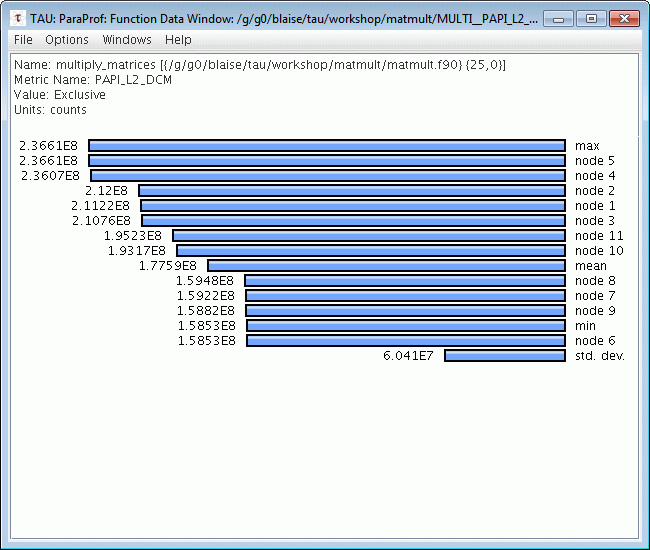
ParaProf includes many features for diving more deeply into your application's behavior - see the TAU Documentation for details. A few representative screenshots are provided below (click for a larger image).
2. Tracing
TAU tracing output consists of two sets of files named tautrace.X.Y.Z and events.X.edf where:
X = MPI rank number
Y = context
Z = thread number
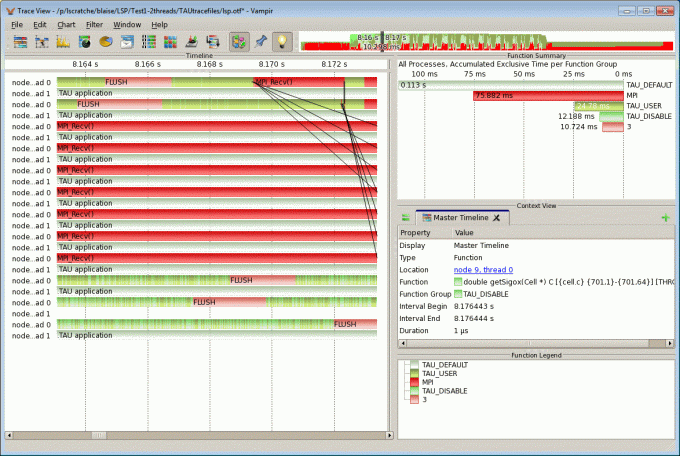
Before TAU's trace files can be viewed, they must first be merged (for parallel jobs) and then converted to a suitable format for viewing by selected trace viewing tools. Two trace viewing tools are covered here.
Vampir/VampirServer
The Vampir trace visualizer provides a variety of means of examining OTF trace data, as generated through VampirTrace, OpenSpeedShop, or TAU. VampirServer is a client/server version of Vampir that can quickly extract and analyze data from large trace files by using a parallel backend. See the Vampir documentation for details.
1. If you have not already done so, load the TAU and Vampir environments:
% module load tau
% module load vampir
2. Go to the directory containing the TAU tracefiles and issue the tau_treemerge.pl command. This will merge all tautrace.* and events.* files into a single tau.trc file and a single tau.edf file.
% tau_treemerge.pl
/usr/global/tools/tau/training/tau-2.23.1/x86_64/bin/tau_merge -m tau.edf -e events.0.edf events.1.edf
events.2.edf events.3.edf events.4.edf events.5.edf events.6.edf events.7.edf tautrace.0.0.0.trc
tautrace.1.0.0.trc tautrace.2.0.0.trc tautrace.3.0.0.trc tautrace.4.0.0.trc tautrace.5.0.0.trc
tautrace.6.0.0.trc tautrace.7.0.0.trc tau.trc
tautrace.0.0.0.trc: 51511 records read.
tautrace.1.0.0.trc: 21897 records read.
tautrace.2.0.0.trc: 21897 records read.
tautrace.3.0.0.trc: 21897 records read.
tautrace.4.0.0.trc: 21099 records read.
tautrace.5.0.0.trc: 21113 records read.
tautrace.6.0.0.trc: 21099 records read.
tautrace.7.0.0.trc: 21099 records read.
3. Convert the two merged TAU trace files into the Vampir otf format using the tau2otf utility:
% tau2otf tau.trc tau.edf matmult.otf
4. Launch Vampir using the name of your otf file:
% vampir matmult.otf
Or to generate OTF2 trace files that may be visualized using the Vampir trace visualizer, please use:
% module load vampir
% setenv TAU_TRACE 1
% setenv TAU_TRACE_FORMAT otf2
% srun -n 4 tau_exec ./matmult
% vampir matmult.otf2
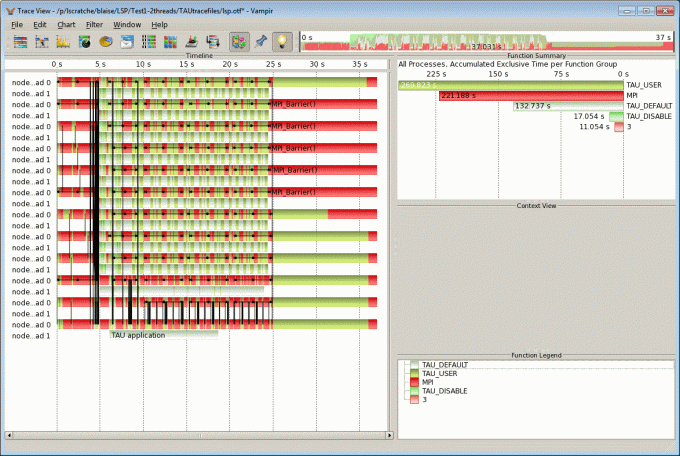
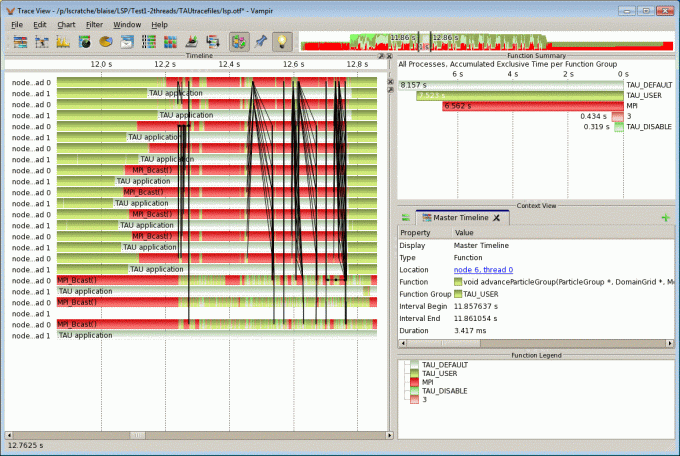
5. The Vampir main window will appear, allowing you to examine your application's trace events. A few representative screenshots are shown below (click for a larger image).
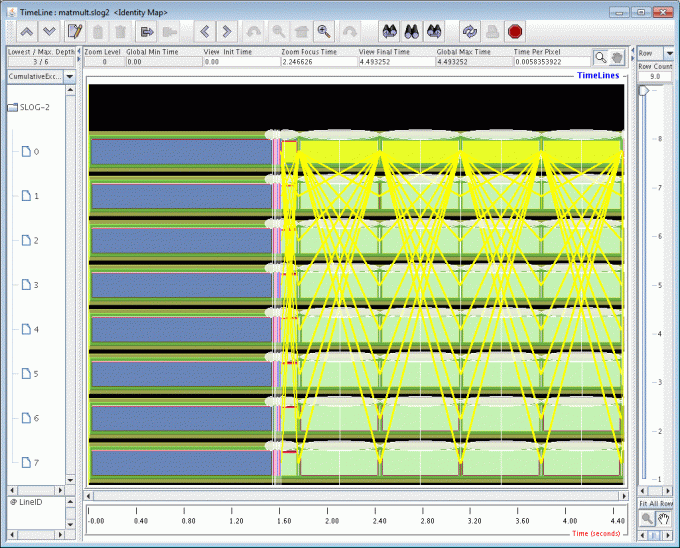
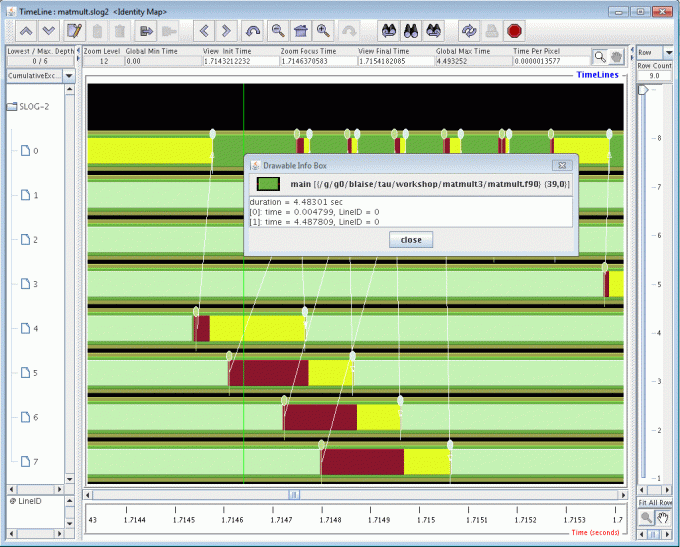
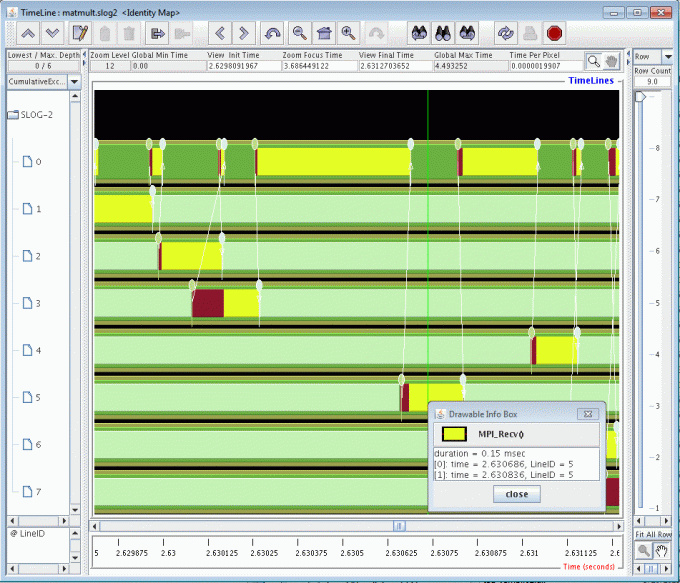
Jumpshot
The Jumpshot trace viewer from Argonne National Laboratory is included with the TAU installation.
1. If you have not already done so, load the TAU environment:
% module load tau
2. Go to the directory containing the TAU tracefiles and issue the tau_treemerge.pl command. This will merge all tautrace.* and events.* files into a single tau.trc file and a single tau.edf file.
% tau_treemerge.pl
/usr/global/tools/tau/training/tau-2.23.1/x86_64/bin/tau_merge -m tau.edf -e events.0.edf events.1.edf
events.2.edf events.3.edf events.4.edf events.5.edf events.6.edf events.7.edf tautrace.0.0.0.trc
tautrace.1.0.0.trc tautrace.2.0.0.trc tautrace.3.0.0.trc tautrace.4.0.0.trc tautrace.5.0.0.trc
tautrace.6.0.0.trc tautrace.7.0.0.trc tau.trc
tautrace.0.0.0.trc: 51511 records read.
tautrace.1.0.0.trc: 21897 records read.
tautrace.2.0.0.trc: 21897 records read.
tautrace.3.0.0.trc: 21897 records read.
tautrace.4.0.0.trc: 21099 records read.
tautrace.5.0.0.trc: 21113 records read.
tautrace.6.0.0.trc: 21099 records read.
tautrace.7.0.0.trc: 21099 records read.
3. Convert the two merged TAU trace files into the Jumpshot slog2 format using the tau2slog2 utility:
% tau2slog2 tau.trc tau.edf -o matmult.slog2
4. Launch Jumpshot using the name of your slog2 file:
% jumpshot matmult.slog2
5. The Jumpshot main window will appear, allowing you to examine your application's trace events. A few representative screenshots are shown below (click for a larger image).
Compiling and Linking
As discussed in the Quick Start section above, TAU can be used to instrument applications without any special need to compile or link. However, using some TAU features does require compiling and linking with TAU components. For the most part, all of this is accomplished by using TAU Makefiles and compiler wrappers as described in steps 1 through 5 under Profiling with TAU Makefiles. Additional information can be found in the TAU documentation.
Run-time Options
TAU has over 30 environment variables that can be used to control run-time behaviors such as:
- Where to write profile/trace files
- Which events/metrics to profile
- Depth of call path to profile
- Throttling
- Verbosity/feedback
- Sampling parameters
- And more...
These are described in the TAU documentation at: https://www.cs.uoregon.edu/research/tau/docs/newguide/bk03apa.html.
Known Issues
On CORAL systems (lassen, rzansel, sierra), if you get the following error:
$ lrun -n 4 tau_exec a.out
a.out: error while loading shared libraries: libmpi.so.12: cannot open shared object file: No such file or directory
...
You may need to add "-T mpi,SPECTRUM" to your tau_exec command line:
$ lrun -n 4 tau_exec -T mpi,SPECTRUM a.out
rank 001 I am a worker: lassen405 (rank=1/4)
rank 000 I am the master: lassen405
rank 003 I am a worker: lassen405 (rank=3/4)
rank 002 I am a worker: lassen405 (rank=2/4)
If you are getting a segmentation fault with the -ebs option, then you will need to set your TAU_PROFILE_FORMAT environment variable to "merged" (export in bash or setenv in csh):
$ export TAU_PROFILE_FORMAT=merged
$ setenv TAU_PROFILE_FORMAT merged
Troubleshooting
- TAU is a complex toolkit, and as such, troubleshooting problems may be difficult for the average user.
- The most common problem is forgetting to load the TAU environment using the use tau command.
- Most problems, if not easily resolved, should be reported to the LC Hotline.
- These may be referred to the TAU development team under LC's support contract.
Documentation and References
The most important TAU links are listed below. Searching the web will find additional TAU documentation and presentations hosted by third parties.
- TAU Home Page: www.cs.uoregon.edu/research/tau/home.php
- TAU Documentation, including User Guides, Installation Guides, Reference Guides, Videos and more: www.cs.uoregon.edu/research/tau/docs.php


