Vampir is a full featured tool suite for analyzing the performance and message passing characteristics of parallel applications. Vampir is based on run-time tracing of program events collected as OTF format files by other tools/libraries, such as VampirTrace, TAU, Score-P, Open|SpeedShop, etc.
Vampir's graphical analysis framework provides a large set of chart representations of an application's event-based tracing performance data. Developers can use these graphical displays, including state diagrams, statistics, and timelines, to obtain a better understanding of the inner workings of their parallel programs and how to optimize them. Powerful zooming and scrolling functionality allows users to quickly extract application performance characteristics at any desired level of detail. Most displays provide additional context information and customization options. Extensive filtering capabilities for processes, functions, messages, and collective operations help to identify interesting hot spots in the overall collection of information. Individual displays can be coupled, with automatic statistic updates.
Platforms and Locations
We currently only have licenses for x86_64 on the quartz system. If you require access to vampir and do not have a quartz account, please submit a request for the quartz system via lc-idm.llnl.gov. Vampir is also available on CORAL systems.
| Platform | Location | Notes |
|---|---|---|
| quartz (x86_64 Linux) | /usr/tce/packages/vampir | Multiple versions may be available. Load with module command. Vampir is only available on quartz. |
| CORAL (ppc64le) | /collab/usr/global/tools/vampir/blueos_3_ppc64le_ib | Multiple versions may be available. Load with module command. |
Quick Start
NOTE: Before using Vampir, you must first have generated OTF format trace files by another tool/library such as VampirTrace, Score-P, TAU or Open|SpeedShop.
1. Determine which module version of Vampir you want to load, and then load that module. In the example below, the default version is loaded. Note that loading the module is required to set the VAMPIR_LICENSE environment variable appropriately.
% module avail vampir

-------------------------- /usr/tce/modulefiles/Core ---------------------------
   vampir/9.1.0 (L)    vampir/9.2    vampir/9.5 (D)

[some output omitted]

% module load vampir
2. Start vampir
% vampir
Example: Using vampir
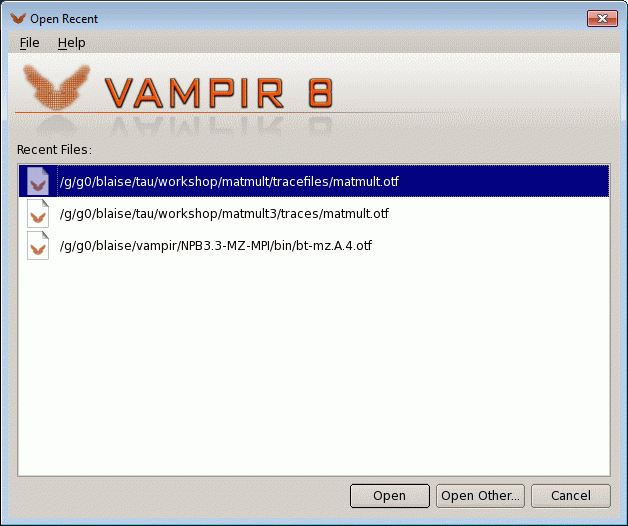
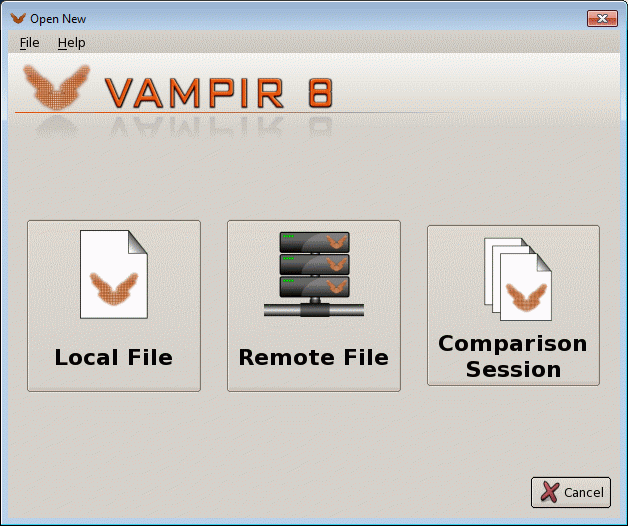
- Simply issue the vampir command. The GUI will start. If you've used it before, you'll be shown the "Open Recent" dialog box, otherwise you'll see the "Open New" dialog box.
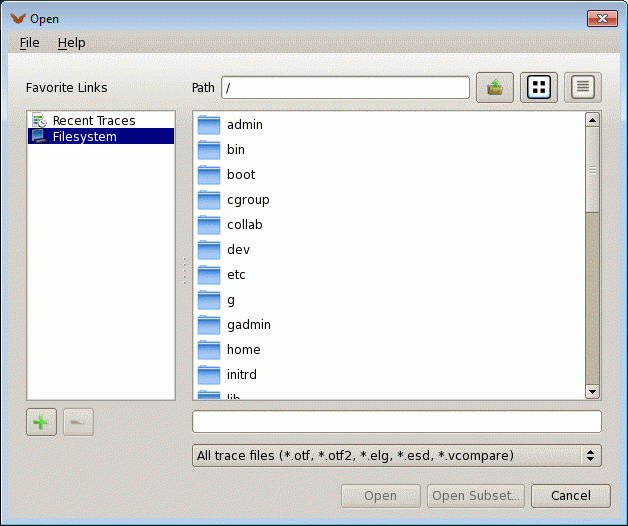
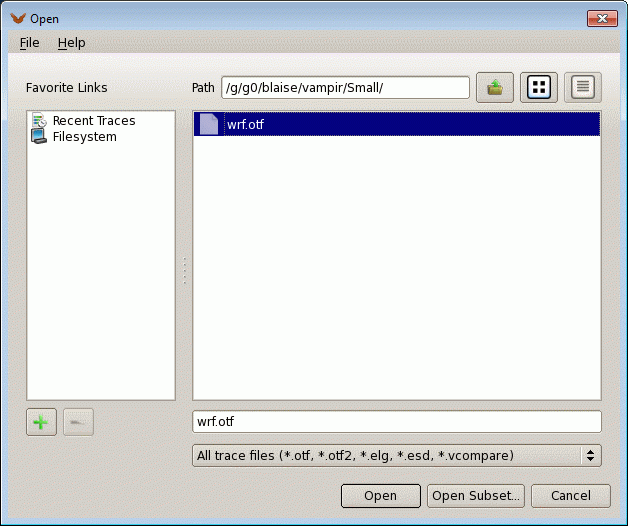
- Assuming your desired OTF file is not shown, navigate to it from either dialog box as appropriate.
- Select the desired OTF file and open it
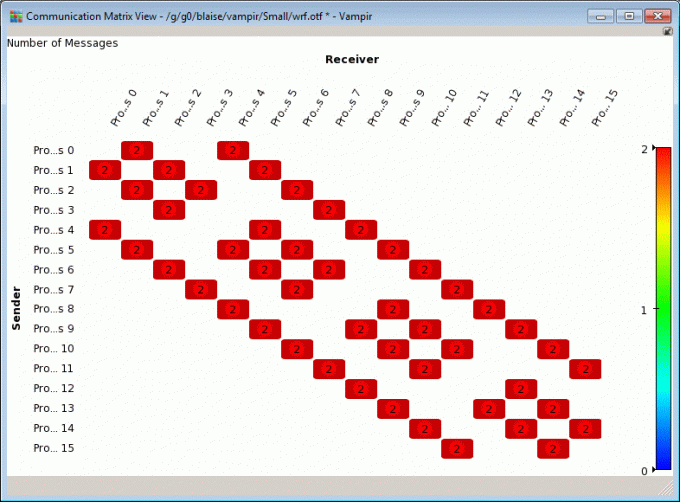
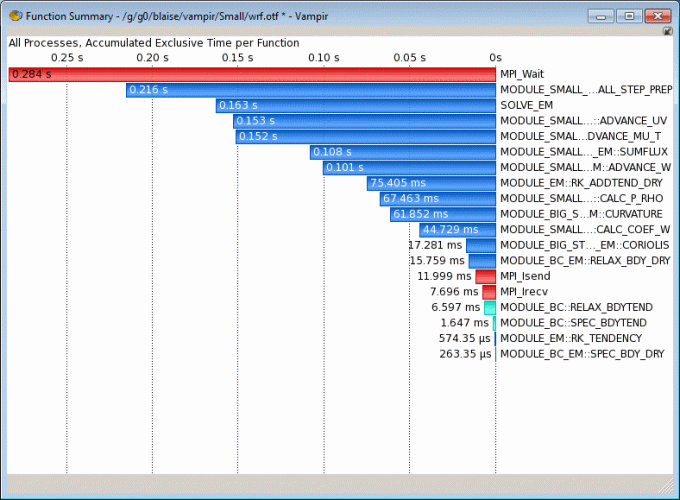
Examples below (click for larger image). While the images below are for Vampir 8, they should apply to Vampir 9 as well. Full current documentation can be found in /usr/tce/packages/vampir/*/doc/vampir-manual.pdf.
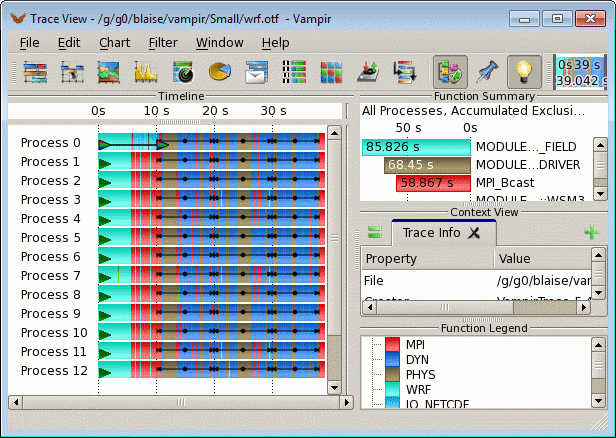
3. View and analyze your application's behavior using the Vampir GUI: After you open your trace file, the "Trace View" window will appear. Example below (click for larger image):
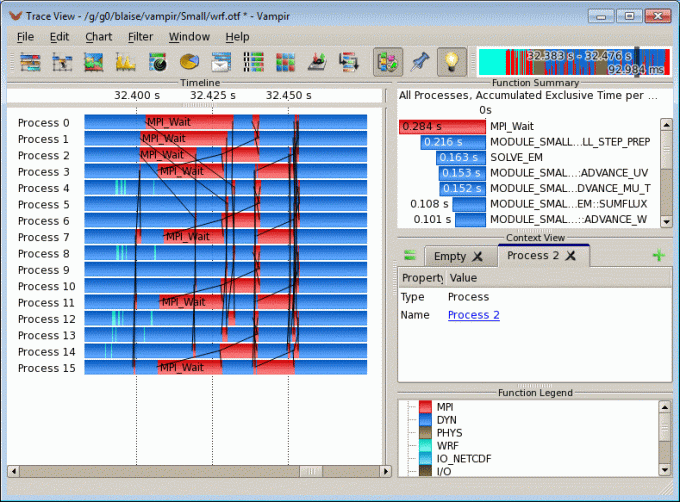
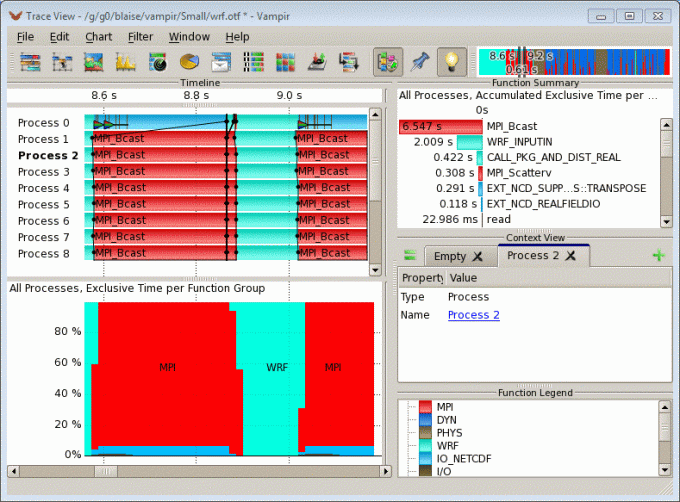
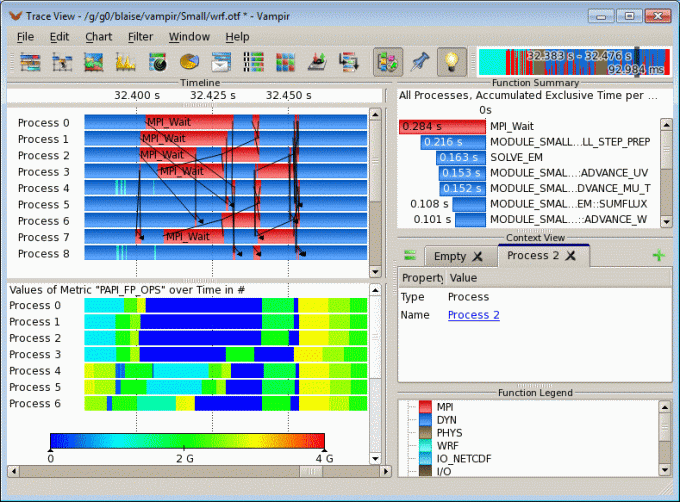
Because Vampir has so many features, users should consult the Vampir documentation to become familiar with its usage. Several examples of its functionality are shown below (click for larger image).
Output
- Vampir does not produce any output files, however they do require as input OTF format trace files produced by another tool/library such as VampirTrace, Score-P, TAU or Open|SpeedShop.
Compiling and Linking
- Users only need to load the vampir module ("use vampir"). No other special compiling or linking is required.
Run-time Options
- Vampir has very few command line options, and they are only used when starting the GUI:
options:
-h   --help              prints out this message
      --presentation      enable presentation mode (visual mouse)
-v   --version           output version information
Troubleshooting
- We currently only have licenses for x86_64 on the quartz system. If you require access to vampir and do not have a quartz account, please submit a request for the quartz system via lc-idm.llnl.gov. Vampir is also available on CORAL systems.
- Vampir is a complex toolkit, and as such, troubleshooting problems may be difficult for the average user.
- The most common problem is forgetting to load the Vampir environment using the module load vampir/version command.
- Most problems, if not easily resolved, should be reported to the LC Hotline.
Documentation and References
- Vampir Website: www.vampir.eu/
- LC installation directory: see the /doc subdirectory for the vampir user manual. For example: /usr/tce/packages/vampir/*/doc/vampir-manual.pdf


