Intel Inspector is a code correctness tool that can identify threading and memory errors in C, C++, and Fortran codes. This tool replaces Intel's old Thread Checker tool, adding memory debugging capabilities and a standalone GUI. Inspector works by performing dynamic analysis (that is, instrumenting and analyzing execution at run time). It can detect intermittent and non-deterministic errors, even if the errors do not manifest themselves.
Platforms and Locations
| Platform | Location | Notes |
|---|---|---|
| Linux x86_64 TOSS 4 |
/usr/tce/packages/inspector | Multiple versions are available. Use module commands to view and load. |
| CORAL ppc64le |
N/A |
Not available on CORAL systems |
Quick Start
Recommended: Watch the 10-minute Intel Inspector introductory video first.
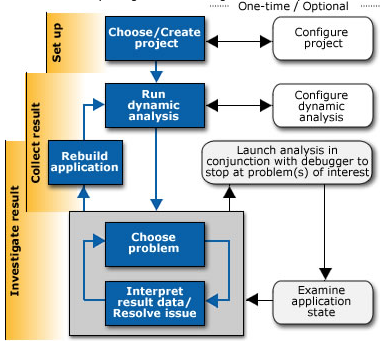
For both thread debugging and memory debugging, Inspector can perform varying degrees of analysis. More in-depth analysis can capture a greater number of bugs but will also take longer to analyze. In general, slowdowns on the order of 2x to 160x can be expected. Thus, it is suggested that users choose a small, representative workload when running the tool rather than a full production workload.
General workflow / usage:
Compiling: Before getting started, compile your code with -g to get debug information and preferably -O0 to ensure the debug information accurately reflects the source code location. Inspector does not require use of Intel compiler. If you do use the Intel compiler, turn off compiler run-time checks such as -fmudflap or -check bounds.
Load desired Inspector module: use the appropriate module commands to view the available Inspector software module packages and load the desired package. For example:
% module avail inspector

---------------------------------- /usr/tce/modulefiles/Core ---------------------------
   inspector/2022.3.0

  Where:
   D:  Default Module

Use "module spider" to find all possible modules.
Use "module keyword key1 key2 ..." to search for all possible modules matching any of the
"keys".

% module load  inspector
Inspector includes both a graphical user interface (GUI) and a command line (CL) interface that can be accessed with the inspxe-gui and inspxe-cl commands, respectively.
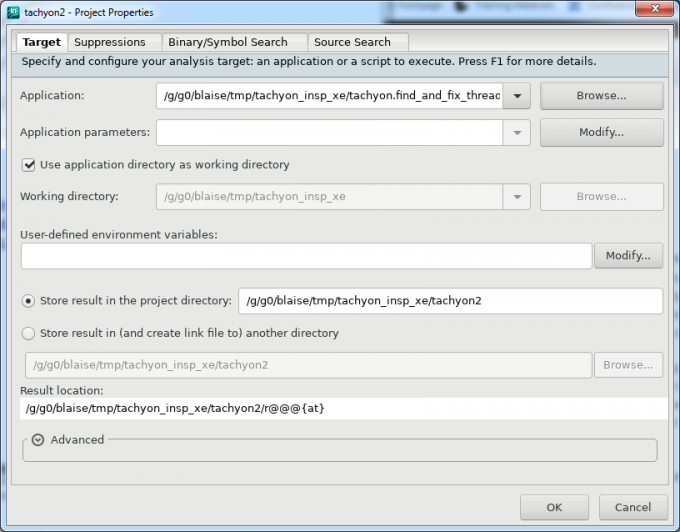
When running the GUI, begin by creating a new project, entering the executable path, arguments, environment variables, and setting other options. For example:
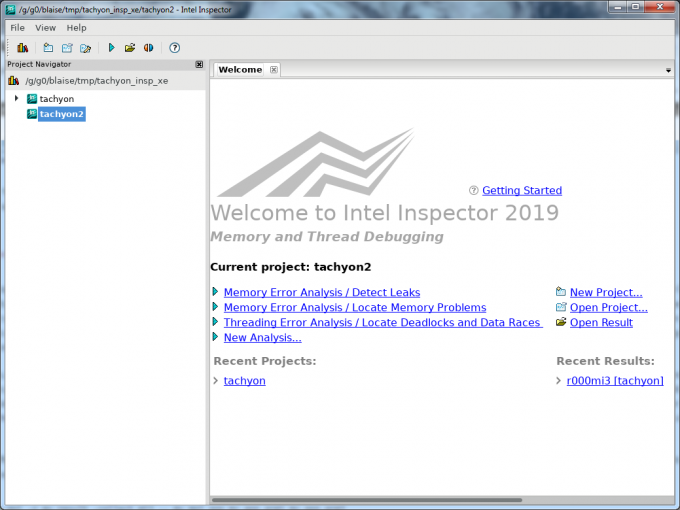
Once the Inspector project is created, set up a new analysis. There are three types of analysis that can be selected as shown below:
- Memory Error Analysis / Detect Leaks
- Memory Error Analysis / Locate Memory Problems
- Threading Error Analysis / Locate Deadlocks and Data Races
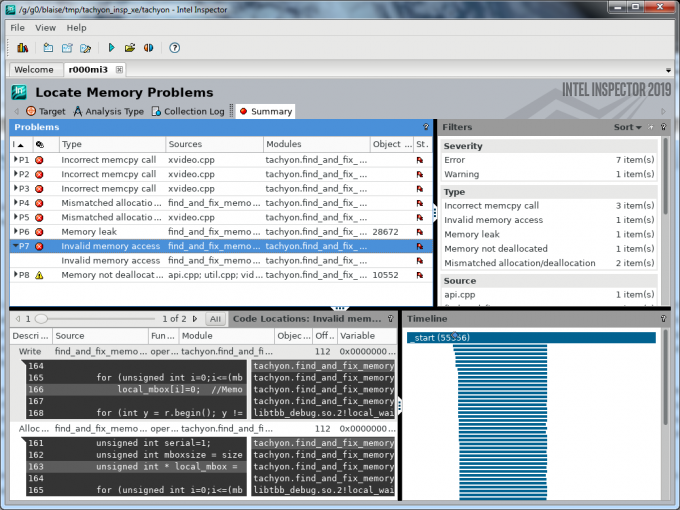
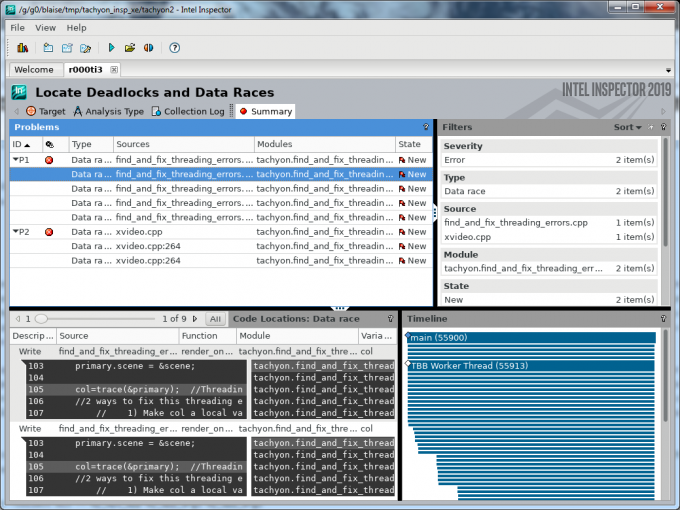
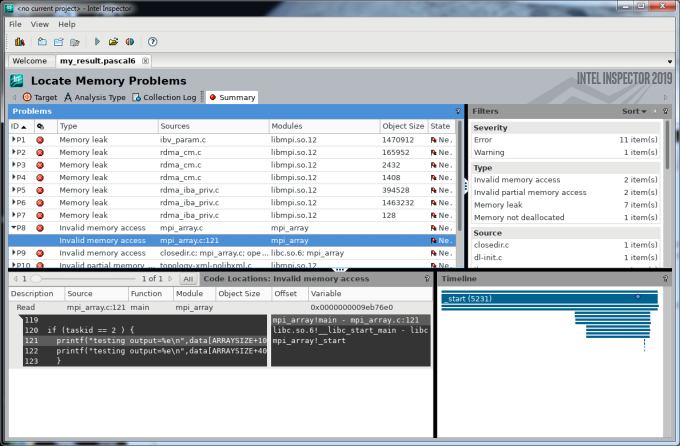
After the analysis completes, the GUI will bring up the Summary view. The Problems pane lists all of the potential errors that Inspector found. Click on a specific problem to display the corresponding source code for the selected problem below in the Code Locations pane. Note that depending on the error type, you may see multiple code locations (e.g., the two access sites in the case of a data race). Right click an item in the Problems pane for various actions such as obtaining a problem explanation or launching an editor on the source file in question. You can also change the state of the problem to confirmed, fixed, or not a problem, which can be helpful for tracking the status of the various issues. The Filters pane on the right side of the GUI allows you to filter the output by various categories such as problem type, library, or source file. (The GUI includes several other features, such as defining suppressions and comparing two analysis results.)
Two examples are shown below: one for Memory Error Analysis and one for Threading Error Analysis. The left-hand navigation pane has been closed for better viewing of the problem information.
MPI Applications
The Inspector User Guide (see Documentation section below) provides a chapter on using Inspector for MPI applications. Only a brief summary is included here.
The inspxe-cl command line interface must be used in conjunction with the MPI launch command, which is srun on LC's Linux clusters. The inspxe-cl command has a number of options, each of which has suboptions. To view available options, use the command: inspxe-cl -help. To view the suboptions for a specific option, use the command inspxe-cl -help <option>. Minimally, you should specify the name for your results directories (-r) and the type of analysis you want (-collect). The available analysis types are:
Name Description
mi1 Detect Leaks
mi2 Detect Memory Problems
mi3 Locate Memory Problems
ti1 Detect Deadlocks
ti2 Detect Deadlocks and Data Races
ti3 Locate Deadlocks and Data Races
In the example below, srun is used to launch 8 MPI tasks across 2 nodes. The inspxe-cl analysis is mi3 (Locate Memory Problems) and the results will be stored in directories named my_results.<hostname>. The user MPI application is my_mpi_app:
% srun -N2 -n8 inspxe-cl -collect mi3 -r my_results my_mpi_app When the application starts, you should see messages like below - one for each MPI task:
Analyzing data in the node-wide mode. The hostname (pascal2) will be added to the result path/name.
Analyzing data in the node-wide mode. The hostname (pascal2) will be added to the result path/name.
Analyzing data in the node-wide mode. The hostname (pascal2) will be added to the result path/name.
Analyzing data in the node-wide mode. The hostname (pascal2) will be added to the result path/name.
Analyzing data in the node-wide mode. The hostname (pascal3) will be added to the result path/name.
Analyzing data in the node-wide mode. The hostname (pascal3) will be added to the result path/name.
Analyzing data in the node-wide mode. The hostname (pascal3) will be added to the result path/name.
In this example, the two hosts used were named pascal2 and pascal3. The results will be stored in the directories:
my_results.pascal2/
my_results.pascal3/
For example, listing my_results.pascal3/ might look like:
% ls -1 my_results.pascal3
config
data.0
data.1
data.2
data.3
inspxe-cl.log
inspxe-cl.txt
log
my_results.pascal3.inspxe
source_cache
summary
suppressions
The file of interest is the one ending in .inspxe. It can be used as input to the inspxe-gui command:
% inspxe-gui my_results.pascal3.inspxeThis will bring up the Inspector GUI loaded with the locations of memory errors. In the example below, both library and user source code memory errors are shown. A user memory error is selected which shows the corresponding source code. Additional details be explored by navigating the GUI.
Usage Notes:
- The inspxe-gui GUI does not provide a means to run an analysis of MPI message passing behavior or performance. Rather it shows only memory and/or thread data race errors across all of the MPI tasks that executed on one node (node-wide).
- It's not obvious if it's possible to identify the specific MPI task where the memory/threading error occurred. If there are 4 tasks and only 2 have an error, it will detect how many error and their source code locations, but not the specific tasks.
- To review the memory/threading errors across the entire MPI job, each node's .inspxe file must be individually loaded into the GUI.
Tutorials
Inspector provides a tutorial in /usr/tce/packages/inspector/default/documentation/en/tutorials/index.htm or on Intel's Inspector Introduction. The example C++ code in the tutorial can be found in /usr/tce/packages/inspector/default/samples/en/C++/tachyon_insp_xe.tgz, and the example Fortran code can be found in /usr/tce/packages/inspector/default/samples/en/Fortran/nqueens_fortran.tgz.
Documentation and References
The Inspector documentation can be found in /usr/tce/packages/inspector/default/documentation/en/welcomepage/get_started.htm or on Intel's documentation.
For more information, visit Intel's Inspector web page.


