The Stack Trace Analysis Tool (STAT) is a highly scalable, lightweight debugger for parallel applications. STAT works by gathering stack traces from all of a parallel application's processes and merging them into a compact and intuitive form. The resulting output indicates the location in the code that each application process is executing, which can help narrow down a bug. Furthermore, the merging process naturally groups processes that exhibit similar behavior into process equivalence classes. A single representative of each equivalence can then be examined with a full-featured debugger like TotalView or DDT for more in-depth analysis.
STAT has been ported to several platforms, including Linux clusters, IBM CORAL systems (i.e., IBM Power CPUs + NVIDIA GPUs), IBM's Blue Gene machines, and Cray systems. It works for Message Passing Interface (MPI) applications written in C, C++, and Fortran, supports threads, and supports CUDA. STAT has already demonstrated scalability over 1,000,000 MPI tasks and its logarithmic scaling characteristics position it well for even larger systems.
STAT is developed as a collaboration between the Lawrence Livermore National Laboratory, the University of Wisconsin, and the University of New Mexico. It is currently open source software released under the Berkeley Software Distribution (BSD) license. It builds on a highly portable, open source infrastructure, including LaunchMON for tool daemon launching, MRNet for scalable communication, and Dyninst for obtaining stack traces.
Platforms and Locations
| Platform | Location | Notes |
|---|---|---|
| x86_64 TOSS 3/4 | /usr/tce/packages/stat/* | Multiple versions are available. Use module to load. |
| CORAL | /usr/tcetmp/packages/stat/* | usage details on LLNL internal wiki (requires authentication): |
Quick Start
In a typical scenario, the STAT GUI (the stat-gui command) is used to debug a running/hung application as described below. STAT can also be used in command-line mode (the stat-cl command), covered in the STAT documentation. For details on how to use STAT on CORAL systems, please refer to the LC Confluence wiki page.
LC -magic to simplify attaching to SLURM and Flux jobs
If you add -magic <jobid> to stat-cl or stat-gui it will automatically do the SLURM/Flux commands necessary to attach to a running job. If you have only one job running (or want to run STAT on all of them), you can put all for <jobid>. Without the -magic, those commands behave the same as before.
    Usage: stat-cl/stat-gui -magic jobid|all <-- passthru_args>

    jobid can refer to a flux allocation or a run inside the current allocation.  Use 'all' as a shortcut to run stat on all currently running jobs/allocations.

    --dir <dir>      // Puts stat_results in <dir> instead of cwd of each job
    -v | --verbose.  // Print all the flux commands run
    -- passthru_args // All args after -- are passed thru to original stat-cl/stat-gui
Here is an example output on a login node of Tuolumne:
    % flux jobs
    JOBID              QUEUE    USER     NAME    ST   NTASKS    NNODES        TIME  INFO
    f2Sod2T846kf pdebug  gyllen   flux           R                1                  1   2.499m tuolumne1024

    % stat-cl -magic f2Sod2T846kf
    Attaching to allocation f2Sod2T846kf with flux proxy --nohup to stat-cl all running jobs Running stat-cl --jobid f2Sod2T846kf  --attach on ffsuCevK gyllen fake_sim R 4 1 1.197m tuolumne1024 at Wed Oct 22 09:40:12 PDT 2025 STAT started at 2025-10-22-09:40:13 Results written to /usr/WS2/gyllen/debug/stat-jobid/stat_results/spindle_bootstrap.f2Sod2T846kf.0000
    DONE with stat-cl -magic, ran stat-cl on 1 job in f2Sod2T846kf Wed Oct 22 09:40:15 PDT 2025
Automatic STAT attach when hang detected
New I/O watchdog-like scripts on_hang_stat_and_kill and on_hang_stat are now available for only CORAL 2 systems (tuolumne, rzadams, elcap). These scripts are designed to be put in your flux batch script on the line before your flux run command. They background-launch an I/O watchdog-like script looking for hangs by looking for pauses in file I/O. If the specified files-to-watch are not updated for a configurable amount of time, actions such as stat-cl -magic all and flux cancel are triggered on all running jobs.
By default, all the on_hang_* scripts now defaults to watching the files flux is sending stdout and stderr to as specified in your batch job and command line. If that is not sufficient, these scripts now supports many "mustache templates" that flux does, like '{{id}}' and custom new ones like '{{stdout}}' (listed in -h output below). Run with -h for the latest help text:
% on_hang_stat_and_kill -h

Usage: on_hang_stat_and_kill <options> <'files_to_watch'>

   Running with no arguments defaults to:
       on_hang_stat_and_kill --thresh 20.0 '{{stdout}} {{stderr}}'

   Runs stat-cl and flux cancel on all running jobs in allocation if
   <'files_to_watch'> are not updated for <thresh> minutes.

   'files_to_watch' defaults to '{{stdout}} {{stderr}}' and must be quoted!
   Supports custom mustache templates {{stdout}} {{output}} {{stderr}} {{error}}
   flux mustache templates {{id}} {{jobid}} {{name}} and
   shell globbing (i.e. '*{{id}}*.out') and watching directories (i.e. '.')

   Example usage inside flux batch script (auto-backgrounds watchdog):
      on_hang_stat_and_kill <options_if_defaults_not_sufficient>
      flux run ... a.out ...

   Options (also accepts --thresh=value and - instead of --):
   --thresh minutes // Trigger if files not updated in <minutes> (20.0 default)
   --reinvoke       // Reinvoke monitoring after hang processed (normally exits)
   --fg             // Run in foreground instead, wait for hang before returning
   -h | --help      // This usage message
Moab/SLURM Jobs
1. First, determine where (which node) the hung application is running. For parallel MPI jobs, this means finding where the srun (or equivalent mpirun, orterun, jsrun, lrun, etc.) master process is running.
On Linux clusters, use either the mjstat or squeue command. For mjstat, look under the "Master/Other" column. For squeue, it is the first node in the node list.
% mjstat

Scheduling pool data:
-------------------------------------------------------------
Pool        Memory  Cpus  Total Usable   Free  Other Traits
-------------------------------------------------------------
pdebug     30000Mb    16     32     32     22
pbatch*    30000Mb    16   1200   1193      5

Running job data:
----------------------------------------------------------------------
JobID    User      Nodes Pool      Status        Used  Master/Other
----------------------------------------------------------------------
787193   user1         4 pbatch    R             1:22  cab124
787048   user2        32 pbatch    R             4:40  cab1164
...
787187   userN        16 pbatch    R             4:42  cab1206


% squeue | grep 787051
787051    pbatch    Wflow schaich2   R      11:19     32 cab[177-196,280-283,288,290,296-299,304-305]
Flux Jobs
For flux, you will first need to use flux job attach --debug <JOBID>, where <JOBID> is the job ID of your flux run command (not the job ID of your flux alloc command), and then attach STAT to the resulting job attach process (not the flux-job process). If you try launching STAT on the process, then you will get an error that looks like, "flux-exec: Error: rank 23: /collab/usr/global/tools/stat/toss_4_x86_64_ib_cray/stat-4.2.1/bin/STATD: Operation not permitted". Below is an example session:
[lee218@fluke6:spack]$ flux jobs -A
       JOBID USER     NAME       ST NTASKS NNODES  RUNTIME NODELIST
    ƒdB2peU7 lee218   a.out       R      8      2   12.89s fluke[6-7]
[lee218@fluke6:spack]$ flux job attach --debug ƒdB2peU7&
[3] 999193
[lee218@fluke6:spack]$ ps x | grep attach
 999172 pts/3    S+     0:00 flux-job attach ƒdB2peU7
 999193 pts/1    S      0:00 job attach --debug ƒdB2peU7
[lee218@fluke6:spack]$ stat-cl 999193
# or attach stat-gui to PID 999193
Note the above assumes you are running STAT within the job allocation. If you have a batch job or are on a login node, you will first need to flux proxy <JOBID>, where the job ID is the Flux allocation, not your running application. For a more complete example:
[lee218@tioga10:src]$ flux jobs -R
       JOBID QUEUE    USER     NAME       ST NTASKS NNODES     TIME INFO
f3tEopf4TQP9 pdebug   lee218   flux        R      1      1    34.3s tioga19

f3tEopf4TQP9:
    fBo7wgsZ          lee218   a.out       R     32      1   6.436s tioga19
[lee218@tioga10:src]$ flux proxy f3tEopf4TQP9
[lee218@tioga10:src]$ flux job attach --debug fBo7wgsZ &
[1] 2101327
[lee218@tioga10:src]$ stat-cl 2101327
Sierra LSF jobs
On Sierra systems, jobs submitted through bsub are no longer placed on a launch node, but rather on the first compute node. Users may use the bquery command to determine which node their lrun/jsrun process resides on. In the example below, the launch node is lassen710, while the first node in the user's compute allocation is lassen348. The lassen348 node will be the node with the jsrun process that we wish to attach to:
[lee218@lassen708:~]$ bsub -nnodes 2  test.sh
Job <1462868> is submitted to default queue <pbatch>.

[lee218@lassen708:~]$ bquery -noheader -X -o 'exec_host' 1462868
1*lassen710:40*lassen348:40*lassen197

[lee218@lassen708:~]$ rsh lassen348 ps x | grep jsrun
 18750 ?        Sl     0:00 /opt/ibm/spectrum_mpi/jsm_pmix/bin/stock/jsrun --np 8 --nrs 2 -c ALL_CPUS -g ALL_GPUS -d plane:4 -b rs -X 1 /usr/tce/packages/lrun/lrun-2020.03.05/bin/mpibind10 /g/g0/lee218/src/STAT/cuda_example.mpi.rzansel 120
2. Start the STAT GUI using the stat-gui command.
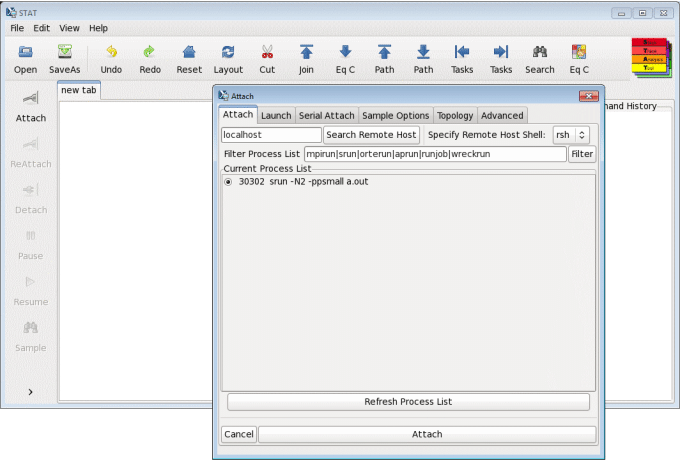
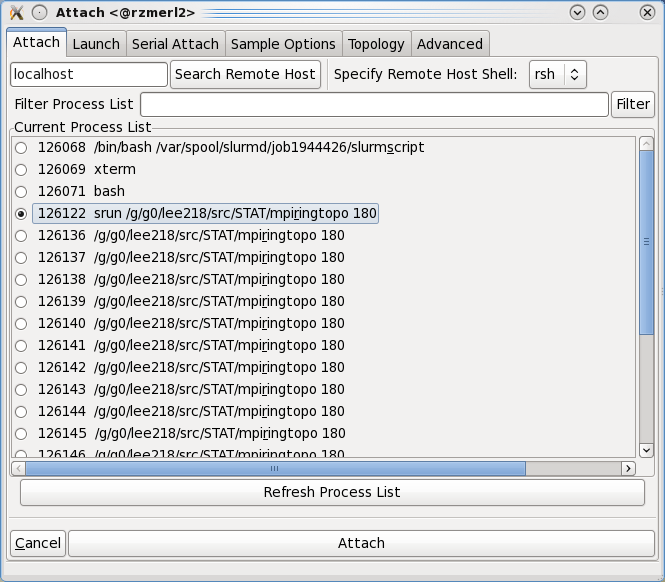
- Case 1: If the srun master process is running on the node where you start STAT, it will appear in STAT's Attach window. Click on the Attach button to have STAT attach to the process and gather a stack trace.
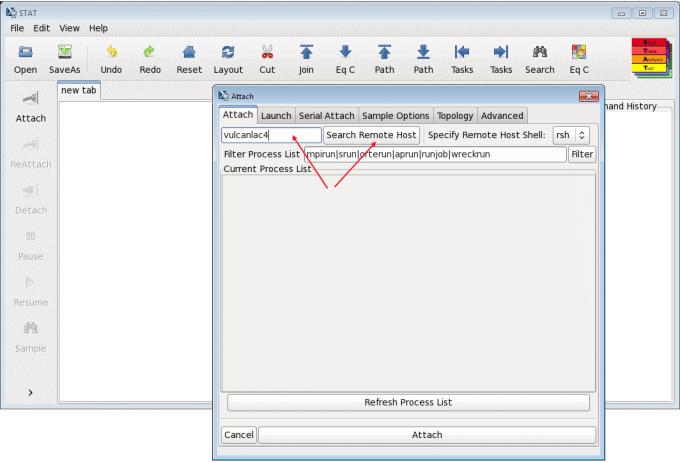
- Case 2: If the srun master process is NOT running on the node where you started STAT, type in the name of the node where it is running (obtained from step 1 above) and then click the Search Remote Host button. STAT will find the srun master process on the remote host, as in Case 1. Then, click on the Attach button to have STAT attach to the process and gather a stack trace.
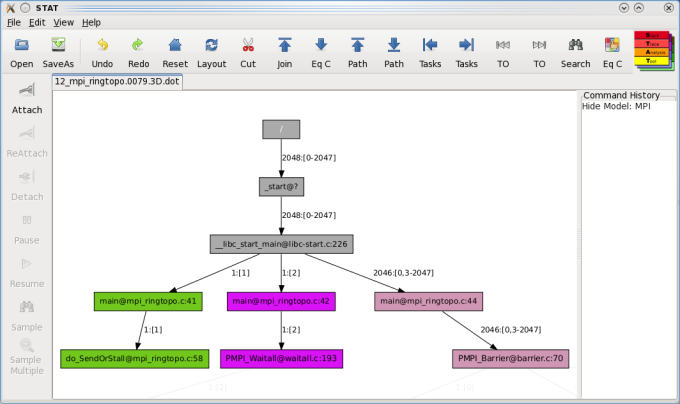
3. After STAT attaches to your application, a merged stack trace will appear (example below). At this point, you are able to interact with the STAT GUI to debug your application. For details on using the STAT GUI, please see the STAT User Guide.
Using the STAT GUI
STAT includes a graphical user interface (GUI) to run STAT and to visualize STAT's outputted call prefix trees. This GUI provides a variety of operations to help focus on particular call paths and tasks of interest. It can also be used to identify the various equivalence classes and includes an interface to attach a heavyweight debugger to the representative subset of tasks.
The STAT GUI is available on TCE systems in /usr/tce/bin/stat-gui and on CORAL systems in /usr/tcetmp/bin/stat-gui. Man pages are also available (man stat-gui). Full documentation can be found in /usr/local/tools/stat/doc/ or /usr/tce/packages/stat/default/doc/ and in the STAT User Guide PDF.
The toolbar on the left allows access to STAT's core operations on the application:
- Attach - creates a dialog (Figure 5) to attach to a parallel application and set various options.
- ReAttach - reattach to the last attached parallel application (bypasses the attach dialog).
- Detach - detach from the application.
- Resume - resumes the stopped application processes.
- Pause - pauses the application processes.
- Sample - pauses the application processes and gathers a single stack trace.
- Sample Multiple - gathers multiple stack traces from the application processes, letting the processes run for a specified amount of time between samples.
The attach dialog allows you to select the application to attach to. Note: You will want to attach to the job launcher process (srun on CHAOS and BlueGene/Q systems or mpirun on BlueGene/P systems). By default, the attach dialog searches the localhost for the job launcher process, but you may specify an alternative hostname in the Search Remote Host text entry field. Thus, you may attach STAT to a batch job from a login node. On TOSS systems, the appropriate host is usually the lowest numbered node in your allocation. In general, to find the appropriate node, you may be able to run:
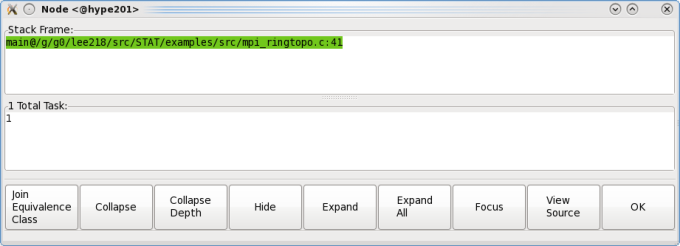
squeue -j <your_slurm_job_id> -tr -o "%.7i %B"When you left click on a node in the graph, you will get a pop-up window that lists the function name and the full set of tasks that took that call path. Right clicking on a node provides a pop-up menu with the same options.
The pop-up window has several buttons that allow you to manipulate the graph, allowing you to focus on areas of interest. Each button is defined as follows:
- Join Equivalence Class - collapses all of the descendent nodes with the same equivalence class into the current node and renders in a new tab.
- Collapse - hide all of the descendants of the selected node.
- Collapse Depth - collapse the entire tree to the depth of the selected node.
- Hide - the same as Collapse, but also hides the selected node.
- Expand - show (unhide) the immediate children of the selected node.
- Expand All - show (unhide) all descendants of the selected node.
- Focus - hide all nodes that are neither ancestors nor descendants of the selected node. (Note: This will not unhide any hidden ancestors.)
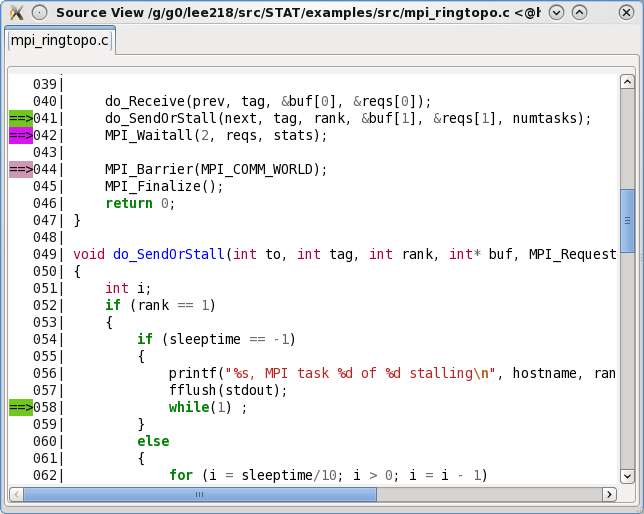
- View Source - creates a popup window (Figure 7) displaying the source file (only for stack traces with line number information). Requires the source file's path to be added to the search path, through File -> Add Search Paths.
- Temporally Order Children (prototype only) - determine the temporal order of the node's children (only for stack traces with line number information). Requires the source file's path and all include paths to be added to the search path, through File -> Add Search Paths.
- OK - closes the pop-up window.
The main window also has several tree manipulation options (note all of these operate on the current, visible state of the tree):
- Undo - Undo the previous operation.
- Redo - Redo the undone operation.
- Reset - Revert to the original graph.
- Layout - Reset the layout of the current graph and open in a new tab. This is useful for compacting wide trees after performing some pruning operations.
- Cut - This feature allows you to collapse the prefix tree below the implementation frames for various programming models. MPI and pthreads are pre-configured in STAT and additional programming models can be specified via regular expressions
- Join - Join consecutive nodes of the same equivalence class into a single node and render in a new tab. This is useful for condensing long call sequences.
- [Traverse] Eq C - Traverse the prefix tree by expanding the leaves to the next equivalence class set. The first click will display the top-level equivalence class.
- [Traverse Longest] Path - Traversal focus on the next longest call path(s). The first click will focus on the longest path.
- [Traverse Shortest] Path - Traversal focus on the next shortest call path(s). The first click will focus on the shortest path.
- [Traverse Least] Tasks - Traversal focus on the path(s) with the next least visiting tasks. The first click will focus on the path with the least visiting tasks.
- [Traverse Most] Tasks - Traversal focus on the path(s) with the next most visiting tasks. The first click will focus on the path with the most visiting tasks.
- [Traverse Least] TO - Temporal Order traversal focus on the path(s) that have made the least execution progress in the application. The first click will focus on the path that has made the least progress.
- [Traverse Most] TO - Temporal Order traversal focus on the path(s) that have made the most execution progress in the application. The first click will focus on the path that has made the most progress.
- Search - Search for call paths containing specified text, taken by specified tasks, or from specified hosts. Search text may be a regular expression, using the syntax described in docs.python.org/library/re.html.
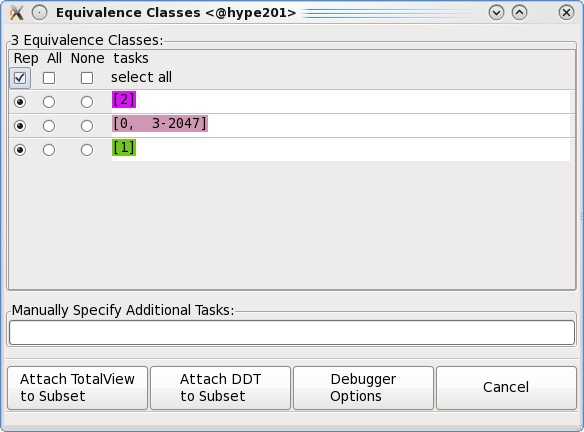
- EQ Classes - identify the equivalence classes of the tree. After clicking on this button, a window will pop up showing the complete list of equivalence classes. You can then select a single representative, all, or none of an equivalence classes' tasks to form a subset. The "Attach" buttons will launch the specified debugger and attach to the subset of tasks (note, this detaches STAT from the application). The "Debugger Options" button allows you to modify the debugger path.
Using the stat-cl Command Line
STAT can also be run from the command line via the stat-cl command. The only required argument to stat-cl is the PID of the srun process, or alternatively the hostname:PID of the srun process if it is running on a different node
bash-4.2$ hostname
corona5
bash-4.2$ ps xw | grep srun
 37453 pts/0    Sl     0:00 srun -n 32 /usr/tce/packages/stat/default/share/stat/examples/bin/mpi_ringtopo
 37457 pts/0    S      0:00 srun -n 32 /usr/tce/packages/stat/default/share/stat/examples/bin/mpi_ringtopo
 39569 pts/0    S+     0:00 grep --color srun
bash-4.2$ stat-cl 37453
STAT started at 2020-09-14-14:19:41
Attaching to job launcher (null):37453 and launching tool daemons...
Tool daemons launched and connected!
Attaching to application...
Attached!
Application already paused... ignoring request to pause
Sampling traces...
Traces sampled!
...
Results written to /g/g0/lee218/stat_results/mpi_ringtopo.0000
Or when running from a remote node:
[lee218@corona82:~]$ rsh corona5 ps x | grep srun
 37453 pts/0    Sl     0:00 srun -n 32 /usr/tce/packages/stat/default/share/stat/examples/bin/mpi_ringtopo
 37457 pts/0    S      0:00 srun -n 32 /usr/tce/packages/stat/default/share/stat/examples/bin/mpi_ringtopo
[lee218@corona82:~]$ stat-cl corona5:37453
STAT started at 2020-09-14-14:21:45
...
STAT will create a stat_results directory in your current working directory. This directory will contain a subdirectory, based on your parallel application's executable name, with the merged stack traces in DOT graphics language format. DOT files can be used to view your application's stack traces (post-execution) with the stat-view utility, which takes .dot files as arguments.
[lee218@corona82:~]$ stat-view stat_results/mpi_ringtopo.0000/*.dot
Automatically Launching STAT Via the IO Watchdog Utility
STAT can be used in conjunction with the IO Watchdog utility, which monitors application output to detect hangs. To enable STAT with the IO Watchdog, add the following to the file $HOME/.io-watchdogrc:
search /usr/local/tools/io-watchdog/actions
timeout = 20m
actions = STAT, kill
You will then need to run your application with the srun --io-watchdog option:
% srun --io-watchdog mpi_applicationWhen STAT is invoked, it will create a stat_results directory in the current working directory, as it would in a typical STAT run. The outputted .dot files can then be viewed with stat-view. For more details about using IO Watchdog, refer to the IO Watchdog README file in /usr/local/tools/io-watchdog/README.
GPU Debugging on CORAL Systems
STAT is capable of gathering host CPU stack traces as well as CUDA GPU stack traces by using cuda-gdb as its backend instead of STAT. This has been enabled by default on CORAL systems by adding the "-G -w" flags to the stat-cl and stat-gui scripts, which specify use the GDB backend and with threads. To revert to the Dyninst backend, which only gathers stack traces from the host processor, but is faster and more reliable, users may run stat-cl-sw or stat-gui-sw.
Run-time Options
STAT includes a number of options, preferences and environment variables that influence how it behaves. See the STAT User Guide, for details.
Troubleshooting
- See the "Troubleshooting" chapter in the STAT User Guide: github.com/LLNL/STAT/blob/develop/doc/userguide/stat_userguide.pdf
- Contact the LC Hotline to report a problem.
Documentation and Links
- STAT User Guide: github.com/LLNL/STAT/blob/develop/doc/userguide/stat_userguide.pdf
- STAT man pages: man stat-gui or man stat-cl (note you man need to module load stat to get your MANPATH properly set)
- Running STAT on CORAL systems, internal web page (requires authentication): LLNL lc.llnl.gov/confluence/pages/viewpage.action?pageId=544145673
- Source code: github.com/LLNL/STAT
References
- Lai Wei, Ignacio Laguna, Dong H. Ahn, Matthew P. LeGendre, Gregory L. Lee, "Overcoming Distributed Debugging Challenges in the MPI+OpenMP Programming Model", Supercomputing 2015, Austin TX, November 2015.
- Dong H. Ahn, Michael J. Brim, Bronis R. de Supinski, Todd Gamblin, Gregory L. Lee, Barton P. Miller, Adam, Moody, and Martin Schulz, "Efficient and Scalable Retrieval Techniques for Global File Properties", International Parallel & Distributed Processing Symposium, Boston, MA, May 2013.
- Dong H. Ahn, Bronis R. de Supinski, Ignacio Laguna, Gregory L. Lee, Ben Liblit, Barton P. Miller, and Martin Schulz, "Scalable Temporal Order Analysis for Large Scale Debugging", Supercomputing 2009, Portland, Oregon, November 2009.
- Gregory L. Lee, Dorian C. Arnold, Dong H. Ahn, Bronis R. de Supinski, Matthew Legendre, Barton P. Miller, Martin Schulz, and Ben Liblit, "Lessons Learned at 208K: Towards Debugging Millions of Cores", Supercomputing 2008, Austin, Texas, November 2008.
- Gregory L. Lee, Dorian C. Arnold, Dong H. Ahn, Bronis R. de Supinski, Barton P. Miller, and Martin Schulz, "Benchmarking the Stack Trace Analysis Tool for BlueGene/L", International Conference on Parallel Computing (ParCo), Aachen and Jülich, Germany, September 2007.
- Dorian C. Arnold, Dong H. Ahn, Bronis R. de Supinski, Gregory L. Lee, Barton P. Miller, and Martin Schulz, "Stack Trace Analysis for Large Scale Applications", International Parallel & Distributed Processing Symposium, Long Beach, California, March 2007.


