
As described on this page, LC provides 3 tools for performance analysis and tracing on the El Capitan systems:
LC also provides tools for debugging.
NOTE In 2025 the OmniPerf and OmniTrace tools were consolidated into the ROCm tools project. The El Capitan, RZAdams, and Tuolumne systems continue to deploy both these tools as "omnitrace" and "omniperf". Future versions of these tools may have different names.
AMD OmniPerf
A recording of an introductory tutorial is available on confluence. See also the official documentation page.
Overview
OmniPerf is a performance analysis tool built on top of the ROC Profiler. It records hardware performance counters for AMD GPUs during and can provide high level performance analysis features, including System Speed-of-Light, IP block Speed-of-Light, Memory Chart Analysis, Roofline Analysis, Baseline Comparisons, and more.
- OmniPerf is best used for analyzing single-node application runs, where a limited number of GPU and CPU kernels are instrumented.
For detailed usage instructions, see the online documentation.
Loading the Tool
The OmniPerf tool is easily accessible by loading the module:
module load omniperf
Quickstart
See the basic usage documentation page for details on profiling and selecting metrics.
Analysis
OmniPerf can provide analysis in 2 ways: through a CLI tool and a Grafana-based GUI built on top of a MongoDB. The current recommendation is to use the CLI analysis tool.
LC is currently in the process of deploying Grafana and MongoDB such that they can be used for OmniPerf analysis.
AMD OmniTrace
A recording of an introductory tutorial is available on confluence. See also the official documentation page.
Overview
OmniTrace is designed for both high-level profiling and comprehensive tracing of applications running on the CPU or the CPU+GPU via dynamic binary instrumentation, call-stack sampling, and various other means for determining currently executing function and line information. It records a timeline of kernel execution (including kernel launches) and records various metrics.
- OmniTrace is best used for analyzing single-node application runs, where a limited number of GPU and CPU kernels are instrumented. The online visualization tools have a maximum of 1 GB memory, thus analyzing very large trace files will not work.
For detailed usage instructions, see the online documentation.
Loading the Tool
The OmniTrace tool is easily accessed by loading the module:
$ module load omnitrace
Instrumenting Binaries
OmniTrace has two distinct configuration steps when instrumenting:
-
Instrumenting with OmniTrace: Configuring which functions and modules are instrumented in the target binaries (i.e., executable and/or libraries)
-
Customizing OmniTrace Runtime: Configuring what the instrumentation does happens when the instrumented binaries are executed
Visualizing Results
Visualization of the comprehensive omnitrace results (proto files) can be visualized with the Google web-based tool perfetto. LC has deployed CZ, RZ, and SCF instances at:
- CZ / SCF: https://lc.llnl.gov/perfetto/
- RZ: https://rzlc.llnl.gov/perfetto/
NOTE DO NOT use the recommended public ui.perfetto.dev website to upload any traces generated by Livermore machines.
Aggregated high-level results are available in text files for human consumption and JSON files for programmatic analysis. The JSON output files are compatible with the python package hatchet which converts the performance data into pandas dataframes and facilitate multi-run comparisons, filtering, visualization in Jupyter notebooks, and much more.
HPCToolKit
See the official documentation.
It is recommended that users begin with QuickStart (User Manual Chapter 3): https://hpctoolkit.gitlab.io/hpctoolkit/
Overview
HPCToolkit is a suite of performance analysis tools designed from the ground-up to work with HPC applications. It uses statistical sampling of timers and hardware counters on CPUs, and monitors GPU operations, gathering instruction-level metrics. HPCToolkit works with multilingual, fully optimized applications that are statically or dynamically linked. It supports measurement and analysis of serial codes, threaded codes (e.g., pthreads, OpenMP), MPI, and hybrid (MPI+threads) parallel codes, as well as GPU-accelerated codes that offload computation to AMD, Intel, or NVIDIA GPUs.
Components
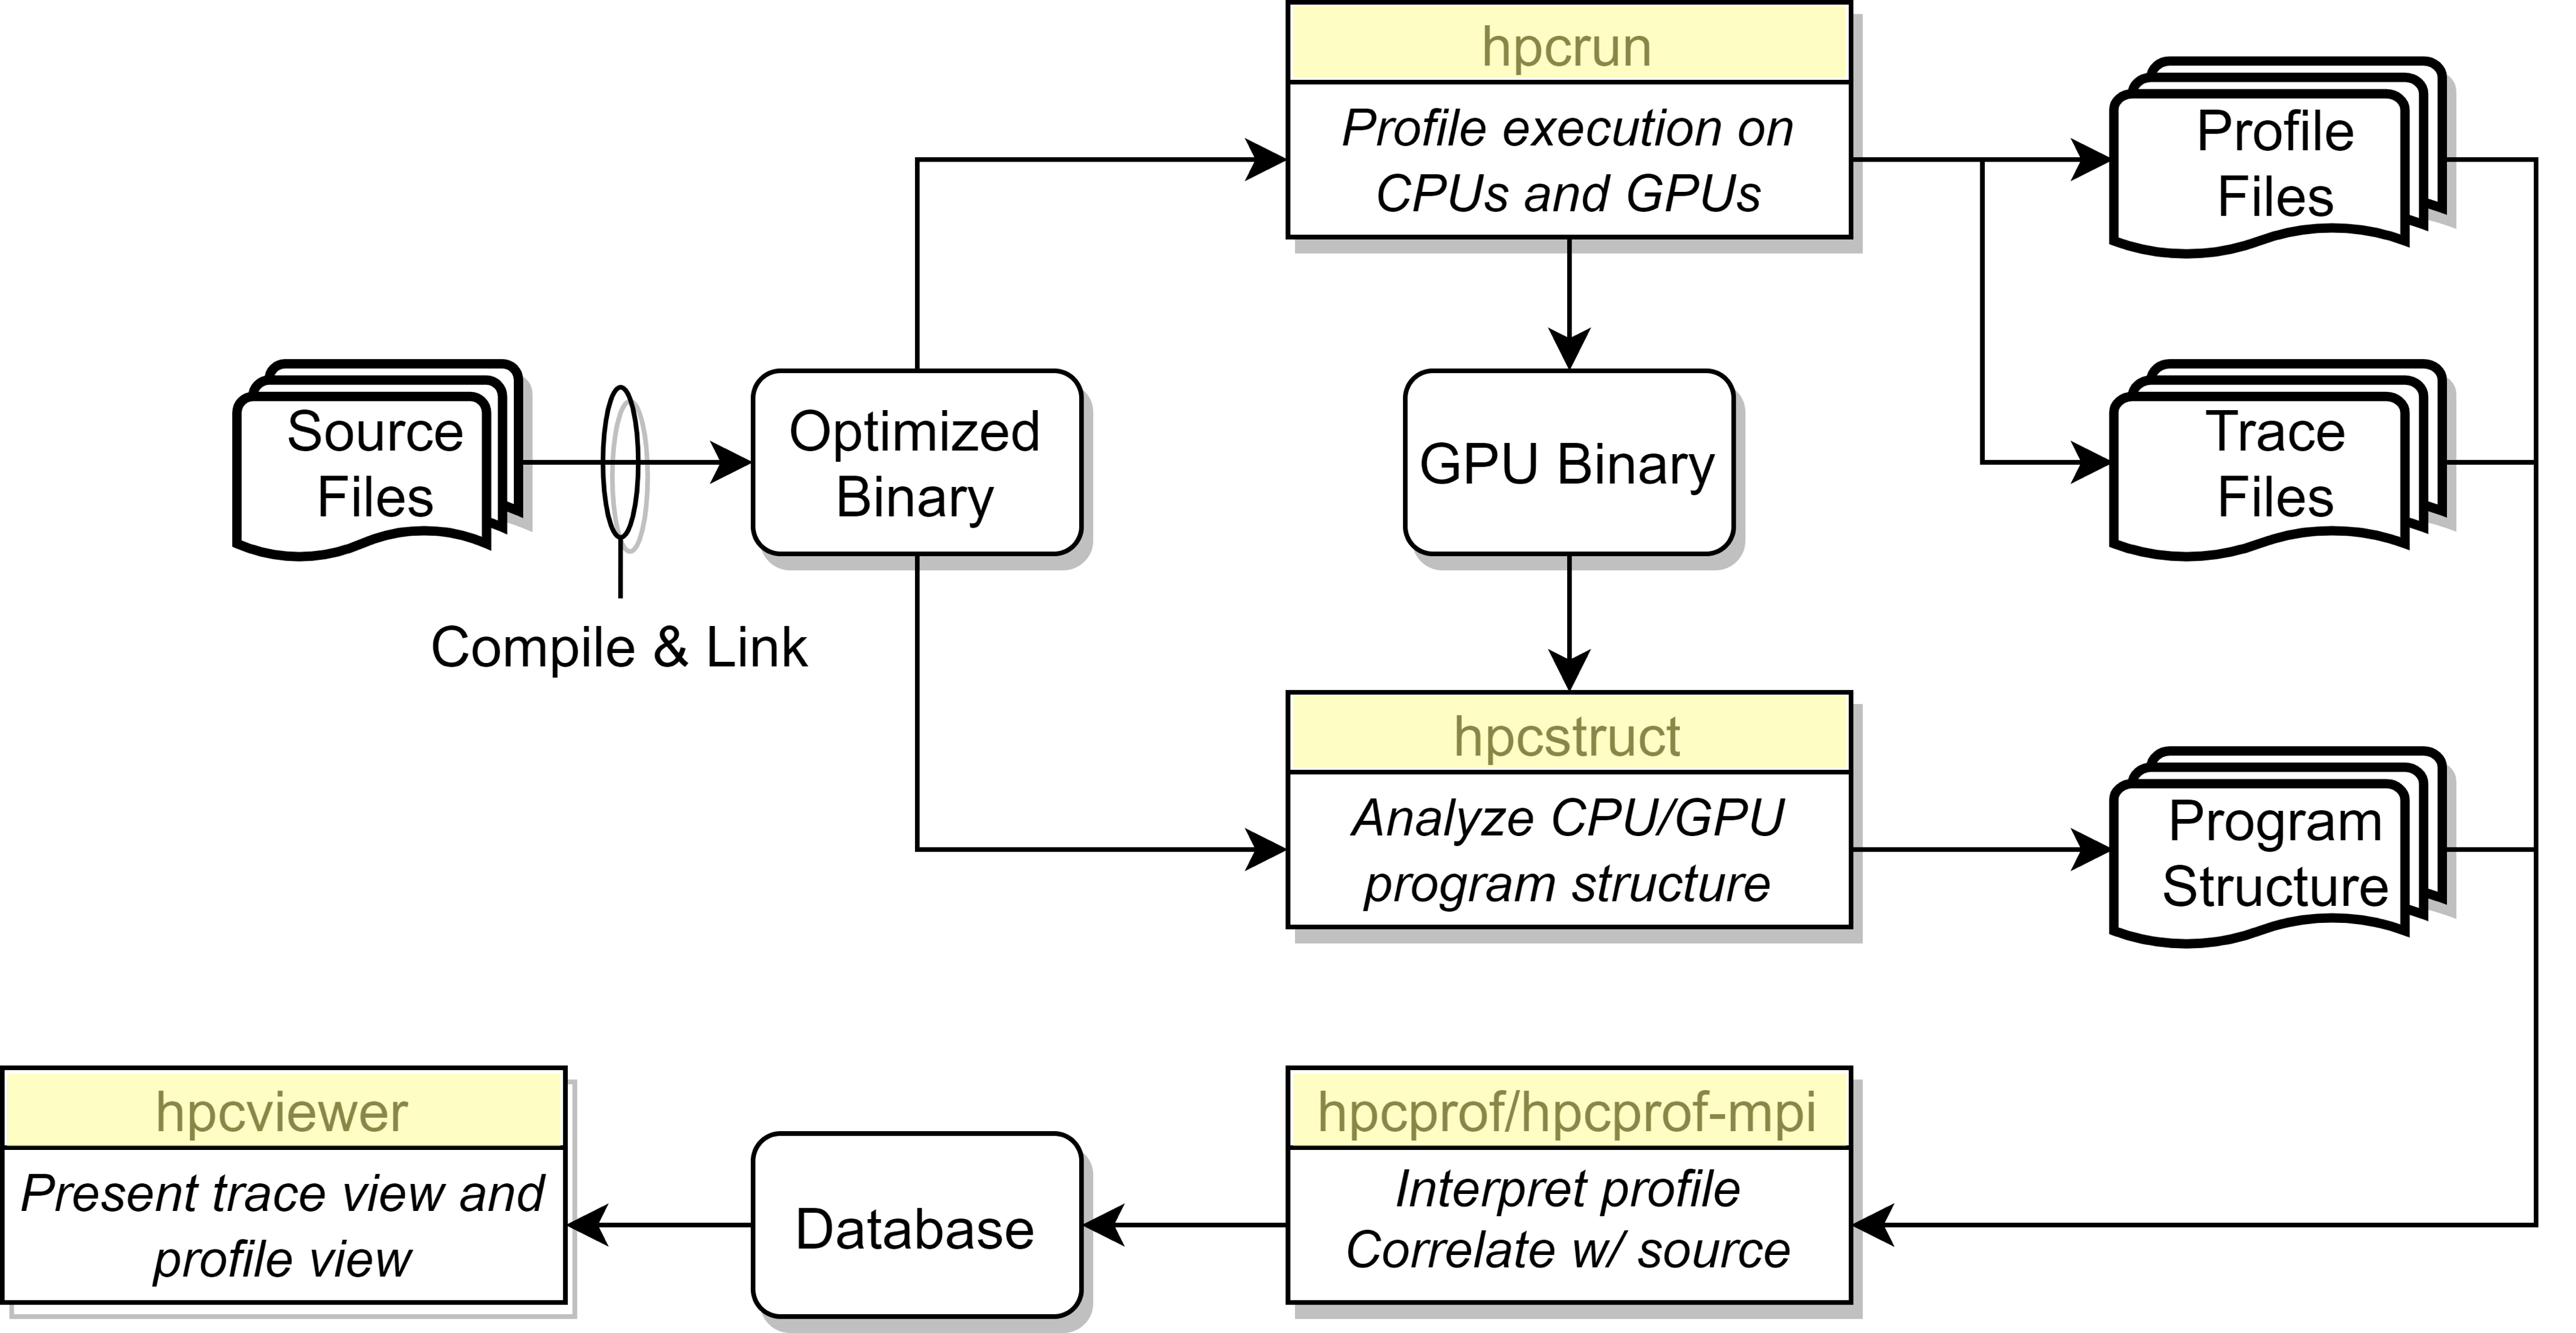
HPCToolkit is a collection of distinct tools.
-
hpcrun: hpcrun collects accurate and precise calling-context-sensitive performance measurements for unmodified fully optimized applications at very low overhead (1-5%). It uses asynchronous sampling triggered by system timers and performance monitoring unit events to drive collection of call path profiles and optionally traces.
-
hpcstruct: To associate calling-context-sensitive measurements with source code structure, hpcstruct analyzes fully optimized application binaries and recovers information about their relationship to source code. In particular, hpcstruct relates object code to source code files, procedures, loop nests, and identifies inlined code.
-
hpcprof: hpcprof overlays call path profiles and traces with program structure computed by hpcstruct and correlates the result with source code. hpcprof-mpi handles thousands of profiles from a parallel execution by performing this correlation in parallel. hpcprof and hpcprof-mpi generate a performance database that can be explored using the hpcviewer user interface.
-
hpcviewer: hpcviewer is a graphical user interface that interactively presents performance data in three complementary code-centric views (top-down, bottom-up, and flat), as well as a graphical view that enables one to assess performance variability across threads and processes. hpcviewer is designed to facilitate rapid top-down analysis using derived metrics that highlight scalability losses and inefficiency rather than focusing exclusively on program hot spots.
-
hpcviewer also presents a hierarchical, time-centric view of a program execution. The tool can rapidly render graphical views of trace lines for thousands of processors for an execution tens of minutes long even a laptop. hpcviewer's hierarchical graphical presentation is quite different than that of other tools - it renders execution traces at multiple levels of abstraction by showing activity over time at different call stack depths.
-
Loading the Tool
The HPCToolkit tools are easily accessibly by loading the module:
module load hpctoolkit
Using the tools
It is recommended that users begin with QuickStart (User Manual Chapter 3): https://hpctoolkit.gitlab.io/hpctoolkit/