Part 1: Resources and Environment
- Resources
- Requesting Accounts—Sarape
- Accessing LC Systems
- Getting Help from LC's HPC Hotline
- File Systems
- System Configuration and Status Information
- Software Overview
- Compilers
- Debuggers
- Performance Analysis Tools
Part 2: Running Jobs
- Basic Concepts
- Basic Functions
- Parallel Jobs and the srun Command
- Running Multiple Jobs From a Single Job Script
- Interactive Jobs
- More Information - LC Documentation and Tutorials
Resources

PSAAP3 Systems Summary
| Cluster | Architecture | Clock Speed (CHz) | Nodes GPUs | Cores / Node / GPU | Cores Total | Memory / Node (GB) | Memory Total (GB) | TFLOPS Peak | Switch |
|---|---|---|---|---|---|---|---|---|---|
| lassen | IBM Power9 NVIDIA Tesla V100 (Volta) |
2.3-3.8 1530 MHz |
774 774*4 |
44 5120 |
34,056 15,851,520 |
256 16*4 |
198,144 49,536 |
22,508 | IB EDR |
| pascal | Intel 18-core Xeon E5-2695 v4 | 2.1 | 171 163*2 |
36 3484 |
6,156 1,135,784 |
256 16*2 |
18,176 5,216 |
206.8 1,727.8 |
Omni-Path |
| quartz | Intel 18-core Xeon E5-2695 v4 | 2.1 | 3,072 | 36 | 110,592 | 128 | 393,216 | 3,715.9 | Omni-Path |
Intel Xeon Systems
- The majority of LC's systems are Intel Xeon based Linux clusters, and include the following processor architectures:
- Intel Xeon 18-core E5-2695 v4 (Broadwell)
- Intel Xeon 8-core E5-2670 (Sandy Bridge - TLCC2) w/without NVIDIA GPUs
- Intel Xeon 12-core E5-2695 v2 (Ivy Bridge)
- Mix of resources:
- 8, 12, and 18 core processors
- OCF and SCF
- ASC, M&IC, VIZ
- Capacity, Grand Challenge, visualization, testbed
- Several GPU enabled clusters
- 64-bit architecture
- TOSS operating system stack
- InfiniBand and Intel Omni-Path interconnects
- Hyper-threading enabled (2 threads/core)
- Vector/SIMD operations
- For detailed hardware information, please see the "Additional Information" references below.
Additional Information
- Linux Clusters Tutorial: hpc.llnl.gov/documentation/tutorials/livermore-computing-linux-commodity-clusters-overview-part-one
- Usage Information for LC's new CTS-1 systems: lc.llnl.gov/confluence/display/TCE/TCE+Home
- Reference list of Intel Xeon Processors: en.wikipedia.org/wiki/List_of_Intel_Xeon_microprocessors
CORAL: LLNL Sierra Systems
- Sierra is a classified, 125-petaflop, IBM Power Systems AC922 hybrid architecture system comprised of IBM POWER9 nodes with NVIDIA Volta GPUs. Sierra is a Tri-lab resource sited at LLNL.
- Unclassified Sierra systems are similar, but smaller, and include:
- Lassen - a 20-petaflop system located on LC's CZ zone
- rzansel - a 1.5-petaflop system is located on LC's RZ zone
- IBM Power Systems AC922 Server: Hybrid architecture using IBM POWER9 processors and NVIDIA Volta GPUs.
- IBM POWER9 processors (compute nodes):
- 2 per node (dual-socket)
- 22 cores/socket; 44 cores per node
- 4 SMT threads per core; 176 SMT threads per node
- Clock: due to adaptive power management options, the clock speed can vary depending upon the system load. At LC speeds can vary from approximately 2.3 - 3.8 GHz. LC can also set the clock to a specific speed regardless of workload.
- NVIDIA GPUs:
- 4 NVIDIA Tesla V100 (Volta) GPUs per compute, login, launch node
- 5120 CUDA cores per GPU; 20,480 per node
- Memory:
- 256 GB DDR4 per compute node
- 16 GB HBM2 (High Bandwidth Memory 2) per GPU; 900 GB/s peak bandwidth
- NVLINK 2.0:
- Interconnect for GPU-GPU and CPU-GPU shared memory
- 6 links per GPU with 300 GB/s total bandwidth
- NVRAM: 1.6 TB NVMe PCIe SSD per compute node
- Network:
- Mellanox 100 Gb/s Enhanced Data Rate (EDR) InfiniBand
- One dual-port 100 Gb/s EDR Mellanox adapter per node
- Parallel File System: IBM Spectrum Scale (GPFS)
- Batch System: IBM Spectrum LSF
- Water (warm) cooled compute nodes
- Additional information:
- Tutorial: hpc.llnl.gov/documentation/tutorials/using-lc-s-sierra-systems
- User Guide: lc.llnl.gov/confluence/display/SIERRA/Sierra+Systems (LC internal wiki)
Requesting Accounts—Sarape
All PSAAP accounts for Tri-lab compute resources must be requested through the web-based SARAPE account request system at sarape.sandia.gov. Note SARAPE requires login. Participating PSAAP centers will have a processing agent who will have login access. Your university processing agent will assist you in submitting the initial request. Most fields are self-explanatory, but some useful hints are provided below:
- Step 2: Requestor's Manager's Info: this pertains to your PSAAP center's designated SARAPE processing agent - that is, the person within your center who authorizes your center's account requests.
- Step 3: Select the Lab where you would like an account and the available machines will appear. If you mouse-over the blue “i” icon next to the machine name, additional information about that machine will appear.
- Step 4: Additional information: For the required "Justification" box, please indicate the name of your PSAAP center and what your work will pertain to.
Following completion of the form, your request will be reviewed by your center's SARAPE processing agent, and if approved, it will then be sent to the Lab(s) where you requested an account. The review and approval processes at each Lab vary, but averages about one week for US citizens. Non-US citizens are required to submit additional paperwork, initiated after the SARAPE request is received at the host site, and requires additional approvals. Processing time for these also varies, between one and three months.
Passwords/Tokens
Each laboratory has its own tokens and/or passwords for access to its resources. If you have accounts at multiple sites you will receive them separately. After accounts are approved and issued, each laboratory has its own process for providing/sending your password and/or token.
Training
All laboratories require users to take online cyber security training on an annual basis. If this required training is not completed, machine accounts will be deactivated.
Account Reauthorization
All three laboratories require annual reauthorization of existing accounts. You will be notified via email regarding this process when your account renewal date approaches.
Accessing LC Systems
Passwords, Authentication and OTP Tokens
One-time Passwords (OTP)

- Single-use passwords are mandatory on all LC machines: classified and unclassified.
- Based upon a "two factor" authentication:
- static, 4-8 character alphanumeric PIN for every user
- 6-digit random number generated by an RSA SecureID token device
- OTP authentication is also used for other services:
- Access to (some) internal LC web pages
- Remote Access Services such as VPN (discussed later)
Problems?
- Under certain circumstances, an OTP server and your token may get out of sync. In such cases it is necessary to enter two consecutive token codes so the server can resynchronize itself. You may also need/want to change your PIN.
- Both of these actions can be performed via the OTP web pages: otp.llnl.gov
- Contact the LC Hotline if problems persist, or for other token related issues/questions: (925) 422-4533 lc-support@llnl.gov
SSH and Access Methods
SSH Required
- Secure Shell (SSH) is required for access to all LC systems.
- The main advantages of SSH are:
- No clear text password goes over network
- The data stream is encrypted
- Use of RSA/DSA authentication between LC clusters
- Mac and Linux users:
- SSH is included on Mac and Linux platforms
- Can simply be used from a terminal window command line. Examples:
ssh joeuser@quartz.llnl.gov
ssh -l joeuser sierra.llnl.gov
- Windows 10 provides an OpenSSH SSH client, which can be used from a Command Prompt window or PowerShell window. Note that you may need to specify the MAC (authentication) type. Examples:
ssh -m hmac-sha2-256 joeuser@quartz.llnl.gov
ssh -m hmac-sha2-512 -l joeuser sierra.llnl.gov
To avoid the need to enter a MAC type each time, simply create a C:\Users\joeuser\.ssh\config file and add the following line to it:
MACs hmac-sha2-256,hmac-sha2-512
- May need to install an SSH app such as PuTTY. Searching the web will reveal other options.
- All production CZ systems can be accessed directly from the Internet.
- Simply use SSH (or for Windows, use your favorite SSH app) and connect to a cluster where you have an account.
- Authenticate with your LC username and CZ PIN + RSA OTP token.
Web Page Access
- The majority of LC's web pages at hpc.llnl.gov are publicly available over the Internet without the need for authentication.
- Web pages located on LC's Confluence Wikis require authentication with an LC username and the relevant domain PIN + OTP token.
- Likewise, web pages located on the MyLC portals require the appropriate LC authentication method.
More Information
- SSH Guide for Livermore Computing (internal wiki): lc.llnl.gov/confluence/display/czconfdocs/SSH+Guide+for+Livermore+Computing
- ssh man page
Where to Login
Login Nodes
- LC clusters have specific nodes dedicated to user login sessions.
- Login nodes are shared by multiple users.
- LC provides a "generic" login alias (cluster login) for each cluster. The cluster login automatically rotates between available login nodes for load balancing purposes.
- For example: quartz.llnl.gov is the cluster login alias - which could be any of the physical login nodes.
- Users don't need to know (in most cases) the actual login node they are rotated onto - unless there are problems. Using the hostname command will indicate the actual login node name for support purposes.
- If the login node you are on is having problems, you can ssh directly to another one. To find the list of available login nodes, use the command: nodeattr -c login
VPN Remote Access Service
- Use of a Remote Access Service (usually VPN) is required if you are outside of the LLNL internal network, and wish to access:
- Institutional network services (LITE, LTRAIN, email, etc.)
- Livermore Computing Restricted Zone (RZ) compute resources
- Provided by the Cyber Security Program
- Not required for access to LC OCF Collaboration Zone (CZ) machines
- To request LLNL VPN access, download software and see setup instructions, go to: access.llnl.gov/vpn/.
- LLNL also offers a browser-based SSL VPN Web Portal:
- The web portal should be used for Internet kiosks, such as at an airport or a conference, to access LLNL systems from off-site.
- This service can be used for submitting your timecard or sending unencrypted email.
- For details, see the link provided above.
Getting Help from the LC Hotline (for HPC)
We have dedicated teams of subject area experts available:
- LC Hotline: (925) 422-4531
- Technical Consultants | lc-hotline@llnl.gov
- Account Specialists | lc-support@llnl.gov
- LC Operations (24/7) | mfopers@llnl.gov
For more information: hpc.llnl.gov/#Contact
File Systems
Home Directories and Login Files
Home Directories
- LC user home directories are global to their network partition: 1 home directory system for the SCF, 1 for the OCF-CZ and 1 for the OCF-RZ.
- Naming scheme: /g/g#/user_name. Examples:
- /g/g15/joeuser
- /g/g0/joestaff
- Backups:
- Online: .snapshot directories - twice daily
- Daily incremental
- Monthly
- Bi-annual offsite disaster recovery
- See the Backups section for details
- NFS mounted:
- Not recommended for parallel I/O
- Quota in effect - see the Quotas section for details.
LC's Login Files
- Your login shell is established when your LC account is initially setup. The usual login shells are supported:
/bin/bash
/bin/csh
/bin/ksh
/bin/sh
/bin/tcsh
/bin/zsh - All LC users automatically receive a set of login files. These include:
.cshrc        .kshenv       .login        .profile
              .kshrc        .logout
.cshrc.linux  .kshrc.linux  .login.linux  .profile.linux
- The files which are "sourced" when you login depends upon your shell.
- Note for bash and zsh users: LC does not provide .bashrc, .bash_profile, .zprofile or .zshrc files at this time.
/usr/workspace File Systems
- LC provides 2 terabytes of NFS mounted file space for each user and group.
- Located under /usr/workspace/username and /usr/workspace/groupname
- /usr/workspace/username is accessible by the user only. /usr/workspace/groupname may be accessed by the group members.
- Similar to home directory:
- Cross mounted from appropriate clusters
- Not purged
- Includes .snapshot directory for twice-daily online backups
- Not intended for parallel I/O
- Different from home directory:
- Not backed up
Temporary File Systems
- /tmp
/usr/tmp
/var/tmp- Different names for the same /tmp file system
- Local to each individual node; very small compared to other temporary file systems
- Note These are virtual file systems - use the node's local memory, which may impact the amount of memory left for the job running on the node.
- Faster than NFS
- No quota, no backups
- Purged between batch jobs
- /p/lustre#
- Lustre parallel file systems
- Global temporary file systems - shared by all users
- Very large, multi-petabyte in size - varies by file system
- Available on most OCF systems
- Quotas are in place for the /p/lustre# file systems
- Not subject to purging
- No backups
- /p/gpfs#
/p/gscratch#- Large, temporary parallel file systems found on Sierra and CORAL EA systems
- IBM Spectrum Scale product (formerly known as GPFS)
- No quotas, subject to purging, no backups
Parallel File Systems
- In a typical cluster, most nodes are compute nodes where programs actually run. A subset of the system's nodes are dedicated to serve as I/O nodes. I/O nodes are also referred to as gateway nodes.
- I/O nodes are the interface to disk resources. All I/O performed on compute nodes is routed to the I/O nodes over the internal switch network (such as InfiniBand).
- The I/O nodes then send the I/O requests to storage servers over the SAN (Storage Area Network) which can be 10Gbit Ethernet or InfiniBand. The storage servers then perform the actual I/O to attached physical disk resources.

- Individual files are stored as a series of "blocks" that are striped across the disks of different storage servers. This permits concurrent access by a multi-task application when tasks read/write to different segments of a common file.
- Internally, file striping is set to a specific block size that is configurable. At LC, the most efficient use of parallel file systems is with large files. The use of many small files is not advised if performance is important.
- Parallelism:
- Simultaneous reads/writes to non-overlapping regions of the same file by multiple tasks
- Concurrent reads and writes to different files by multiple tasks
- Concurrent reads/writes supported by MPI I/O and also file-system API, for Lustre or GPFS.
- I/O will be serial if tasks attempt to use the same stripe of a file simultaneously.
Parallel File Systems—Lustre
- Many of LC'sx86 Linux clusters use Lustre parallel file systems.
- To the user, appears as another mounted file system.
- Naming scheme: /p/lustre# for Linux. For example:
% bdf | grep lustre
172.19.1.165@o2ib100:172.19.1.    4.9P   1.1P   3.9P  22%  /p/lustre3
172.19.3.1@o2ib600:172.19.3.2@     15P   3.8P    12P  25%  /p/lustre2
172.19.3.98@o2ib600:172.19.3.9     15P   622T    15P   5%  /p/lustre1
- LC's Lustre parallel file systems are usually mounted by more than one Linux cluster.
- No backups
- /p/lustre# enforces quotas and is NOT subject to purging
- For additional information also see: wiki.lustre.org
Parallel File Systems—IBM Spectrum Scale (GPFS)
- LC's Sierra and CORAL EA systems use IBM's Spectrum Scale parallel file systems (formerly known as GPFS).
- From a user perspective, they look and feel like Lustre parallel file systems on other LC clusters.
- Naming scheme: /p/gpfs# for Sierra clusters, and /p/gscratch# for CORAL EA clusters. For example:
% bdf | grep gpfs
gpfs1                             140P    13P   127P   9%  /p/gpfs1
% bdf | grep gscratch
gpfs0                             1.3P   379T   915T  30%  /p/gscratchr
- No backups, subject to purging, no quotas - currently.
LC Parallel File Systems Summary
- Shows which clusters mount which parallel file systems. File system capacities are also shown.
- As of Jan 2020. Subject to change.
| OCF-CZ | lustre1 15 PB |
lustre2 15 PB |
lustre3 4.9 PB |
gpfs1 24 PB |
|---|---|---|---|---|
| borax | X | X | ||
| lassen | X | |||
| oslic | X | X | X | X - lassengpfs1 |
| pascal | X | X | ||
| quartz | X | X |
Archival HPSS Storage

- High Performance Storage System (HPSS) archival storage is available on the OCF.
- Provides disk/tape archive storage in the petabyte range. Both capacity and performance are continually increasing to keep up with the ever increasing user demand.
- GigE connectivity to all production clusters
- Primary components:
- Server machines
- RAID disk cache
- Magnetic tape libraries
- Jumbo frame GigE network
- FTP client on LC production machines defaults to an enhanced parallel HPSS FTP client
- No back up, no purge
Access Methods and Usage:
- The HPSS system is named storage.llnl.gov on the OCF.
- All LC users automatically receive an HPSS storage account with their regular production machine account.
- Data Transfer Tools: The more commonly used ones are simply listed here and described in more detail in the File Transfer and Sharing section that follows later.
- Hopper: hpc.llnl.gov/software/data-management-tools/using-hopper
- FTP/PFTP: hpc.llnl.gov/documentation/user-guides/using-ftp-file-transfer-protocol
- NFT: hpc.llnl.gov/documentation/user-guides/using-lc-file-systems/using-nft
- HTAR: hpc.llnl.gov/documentation/user-guides/using-htar-hpss-tape-archiver
- Tri-lab high bandwidth file transfers over SecureNet (see the File Transfer and Sharing section)
- Note ssh/scp/sftp to storage are not supported.
- Quotas:
- Based on a user's annual growth in HPSS file space
- OCF yearly growth quota (FY20): 300 TB
- For details see Technical Bulletin 534 (/technical-bulletin-534-fy20-hpss-yearly-growth-quotas)
- How much storage am I using? The aquota command (which can only be run on oslic) provides this information. For example:
oslic5% kinit
[authenticate here]

oslic5% aquota
Welcome to HPSS Quota Server oslici.llnl.gov

aq> show allowance

Pool Name                 Pool Manager  Allowance
------------------------  ------------  ---------------
lcreserve                 lc-hotline             0.0 B
default                   lc-hotline             1.5 TB
   Total                                         1.5 TB

From 10/01/2019 through 02/06/2020:
     5 files created.
     46.8 GB of data used. 3.12% of total.
     Avg. Per Month:  11.1 GB

Total Data:      85.1 TB
Total Files:     2127240

aq>
Usage notes:
- Currently, you must be logged into oslic to use this command.
- Use the aquota help subcommand for additional options.
- You may need to authenticate with the kinit command first.
Additional Information
- HPSS Home Page: www.hpss-collaboration.org
/usr/gapps, /usr/gdata File Systems
- LC provides shared, collaborative, NFS file space for user developed and supported applications and data on LC systems: /usr/gapps, /collab/usr/gapps/, /usr/gdata, /collab/usr/gdata
- Unlike your home directory, these file systems can be used (with approval) to share file space within a group or even the world.
- For convenience, OCF-RZ users can use /collab/usr/gapps and /collab/usr/gdata to share files with OCF-CZ users.
- Backups:
- Online: .snapshot directories.
- Daily incremental
- Monthly
- Bi-annual offsite disaster recovery
- See the Backups section for details.
- Never purged
- Multiple architectures are handled through the $SYS_TYPE variable:
- Every LC machine sets this environment variable to a specific string that matches its architecture. For example:
toss_3_x86_64_ib
blueos_3_ppc64le_ib
- Versions of code built for specific architectures are placed in subdirectories named to match $SYS_TYPE strings
- User scripts can select the appropriate code versions based upon the $SYS_TYPE setting. For example: cd /usr/gapps/myApp/$SYS_TYPE/bin
- Requesting a directory within /usr/gapps: submit the LC USR_GAPPS form to create/change/delete a directory.
- Sharing files and directories in your /usr/gapps directory with a group:
- Create and manage UNIX groups: lc-idm.llnl.gov
- Then use UNIX permissions to permit group sharing
- For additional information see the /usr/gapps web page
Quotas
Home Directories
- The default home directory quota is 24 GB per user.
- Other file systems can have quotas. The /p/lustre# file systems, in particular, have a 3-tier quota system:
| Quotas | Tier 1 (default) | Tier 2 | Tier 3 |
|---|---|---|---|
| space | 20 TB | 50 TB | over 50 TB |
| inodes | 1 M | 10 M | over 10 M |
| process | automatic | email LC Hotline | email LC Hotline |
| duration | system life | system life | up to 1 year |
- Lustre quotas are discussed in detail at: myconfluence.llnl.gov/display/RAM/LustreX
- To check usage and limits: quota -v
- Example:
% quota -v

Disk quotas for joeuser:
Filesystem     used   quota  limit    timeleft  files  quota  limit    timeleft
/g/g0          1.1G   24.0G  24.0G              3.9K   n/a    n/a
/g/g10         -0-    24.0G  24.0G              -0-    n/a    n/a
...
/g/g92         -0-    24.0G  24.0G              -0-    n/a    n/a
/g/g99         -0-    24.0G  24.0G              -0-    n/a    n/a
/usr/gapps     -0-    n/a    n/a                -0-    n/a    n/a
/collab/usr/gapps
               -0-    n/a    n/a                -0-    n/a    n/a
/usr/give      -0-    25.0G  25.0G              -0-    n/a    n/a
/usr/global    -0-    32.0G  32.0G              -0-    n/a    n/a
/collab/usr/global
               -0-    32.0G  32.0G              -0-    n/a    n/a
/usr/workspace/wsa
               -0-    n/a    n/a                -0-    n/a    n/a
/usr/workspace/wsb
               -0-    n/a    n/a                -0-    n/a    n/a
/p/lustre1     24.5K  18.0T  20.0T              0.0K   900.0K 1.0M
/p/lustre2     24.5K  18.0T  20.0T              0.0K   900.0K 1.0M
- Requests for additional disk space should be directed to the LC Hotline through your computer coordinator or PI.
- To view usage by user per file system, see the log files located in /usr/global/docs/filerUsageInfo
- Exceeding quota:
- Warning appears in login messages if usage over 90% quota
- Heed quota warnings - risk of data loss if quota is exceeded!
Other File Systems
- HPSS archival storage: quotas in effect as discussed in Archival HPSS Storage section.
Purge Policies
- When file systems become full, performance can be significantly degraded. Because of this, LC maintains policies for purging temporary file systems.
- The following temporary file systems are subject to purging:
/tmp
/usr/tmp
/var/tmp
/nfs/tmp#
- The /p/lustre# temporary file systems are NOT subject to purging since they enforce quotas. Likewise for the /p/gpfs# file systems once quotas are implemented for them.
- When are files purged?
- /tmp, /var/tmp, /usr/tmp: node-local temporary file space is purged daily and/or in between batch jobs.
- Files in temporary file systems are not backed up
- Don't forget: tmp in the name means temporary!
Backups
Online .snapshot Directories
- User home directories, /usr/workspace, /usr/gapps and /usr/gdata have a special, online directory for regular, automatic backups.
- "Hidden" .snapshot subdirectory
- You can cd .snapshot
- Contains multiple subdirectories, each containing a full backup and a timestamp when the backup was created.
- .snapshot is read-only directory
Livermore Computing System Backups
- LC performs regular backups of the following file systems:
- /g/g#: User home directories
- /usr/gapps, /usr/gdata: User application and data directories
- /usr/local, /usr/global: LC developed or maintained application directories
- Atlassian Tools: Jira, Confluence, etc.
- GItlab
- Daily backups of new or changed files
- Full monthly backup of all files. Retained onsite for 6 months.
- Disaster recovery backups:
- Performed every 6 months
- Data is stored offsite at the Nevada Test Facility
- Retained for 2 years
- For detailed information on LC backups, see the internal wiki document located at: lc.llnl.gov/confluence/display/LCBackups/LC+Backups+Home (requires authentication)
Note Temporary and parallel file systems are not backed up:
- /tmp, /var/tmp, /usr/tmp
- /p/lustre#
- /p/gscratch#
- /p/gpfs#
Archival HPSS Storage
- Users are responsible for backing up all other data they wish to preserve, particularly any files residing in temporary file systems.
- The preferred location for these backups is the archival HPSS storage system.
- See the Archival HPSS Storage section for details.
File Transfer and Sharing
File Transfer Tools
- There are a number of ways to transfer files - depending upon what you want to do.
- hopper - A powerful, interactive, cross-platform tool that allows users to transfer and manipulate files and directories by means of a graphical user interface. Users can connect to and manage resources using most of the major file transfer protocols, including FTP, SFTP, SSH, NFT, and HTAR. See the hopper web pages (hpc.llnl.gov/software/data-management-tools/using-hopper), hopper man page or use the hopper -readme command for more information.
- ftp - Is available for file transfer between LC machines. The ftp client at LC is an optimized parallel ftp implementation. It can be used to transfer files with machines outside LLNL if the command originates from an LLNL machine and the foreign host will permit it. FTP to LC machines from outside LLNL is not permitted unless the user is connected via an appropriate Remote Access service such as OTS or VPN. Documentation is available via the ftp man page or the FTP Usage Guide (hpc.llnl.gov/documentation/user-guides/using-ftp-file-transfer-protocol)
- scp - (secure copy) is available on all LC machines. Example:
scp thisfile user@host2:thatfile - sftp - Performs ftp-like operations over encrypted ssh.
- MyLC - Livermore Computing's user portal provides a mechanism for transferring files to/from your desktop machine and your home directory on an LC machine. See the "utilities" tab. Available at mylc.llnl.gov
- nft - (Network File Transfer) is LC's utility for persistent file transfer with job tracking. This is a command line utility that assumes transfers with storage and has a specific syntax. Documentation is available via its man page or the NFT Reference Manual (hpc.llnl.gov/documentation/user-guides/using-lc-file-systems/using-nft).
- htar - Is highly optimized for creation of archive files directly into HPSS, without having to go through the intermediate step of first creating the archive file on local disk storage, and then copying the archive file to HPSS via some other process such as ftp. The program uses multiple threads and a sophisticated buffering scheme in order to package member files into in-memory buffers, while making use of the high-speed network striping capabilities of HPSS. Syntax resembles that of the UNIX tar command. Documentation is available via its man page or the HTAR Reference Manual (hpc.llnl.gov/documentation/user-guides/using-htar-hpss-tape-archiver).
- hsi - Hierarchical Storage Interface. HSI is a utility that communicates with HPSS via a user- friendly interface that makes it easy to transfer files and manipulate files and directories using familiar UNIX-style commands. HSI supports recursion for most commands as well as CSH-style support for wildcard patterns and interactive command line and history mechanisms. Documentation is available via its man page.
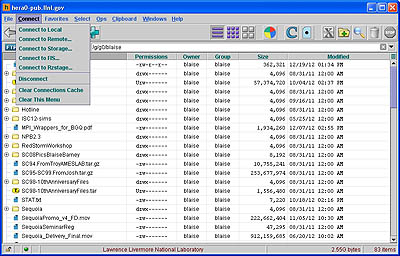
- Tri-lab high bandwidth file transfers over SecureNet:
- All three Labs support wrapper scripts for enhanced data transfer between sites - classified side only.
- Three different protocols can be used: hsi, htar and pftp.
- Transfers can be from host to storage or host to host
- Commands are given names that are self-explanatory - see the accompanying image at right.
- At LLNL, these scripts should already be in your path
- For additional information please see aces.sandia.gov/tri_lab_home.html#file_xfer (requires authentication)
System Configuration and Status Information
- Before you attempt to run your parallel application, it is important to know a few details about the way the system is configured. This is especially true at LC where every system is configured differently and where things change frequently.
- It is also useful to know the status of the machines you intend on using. Are they available or down for maintenance?
- System configuration and status information for all LC systems is readily available from the LC Homepage and the MyLC Portal.
- LC Homepage: hpc.llnl.gov ==> Hardware ==> Compute Platforms
- Direct link: hpc.llnl.gov/hardware/compute-platforms
- All production systems appear in a summary table showing basic hardware information.
- Clicking on a machine's name will take you to a page of detailed hardware and configuration information for that machine.
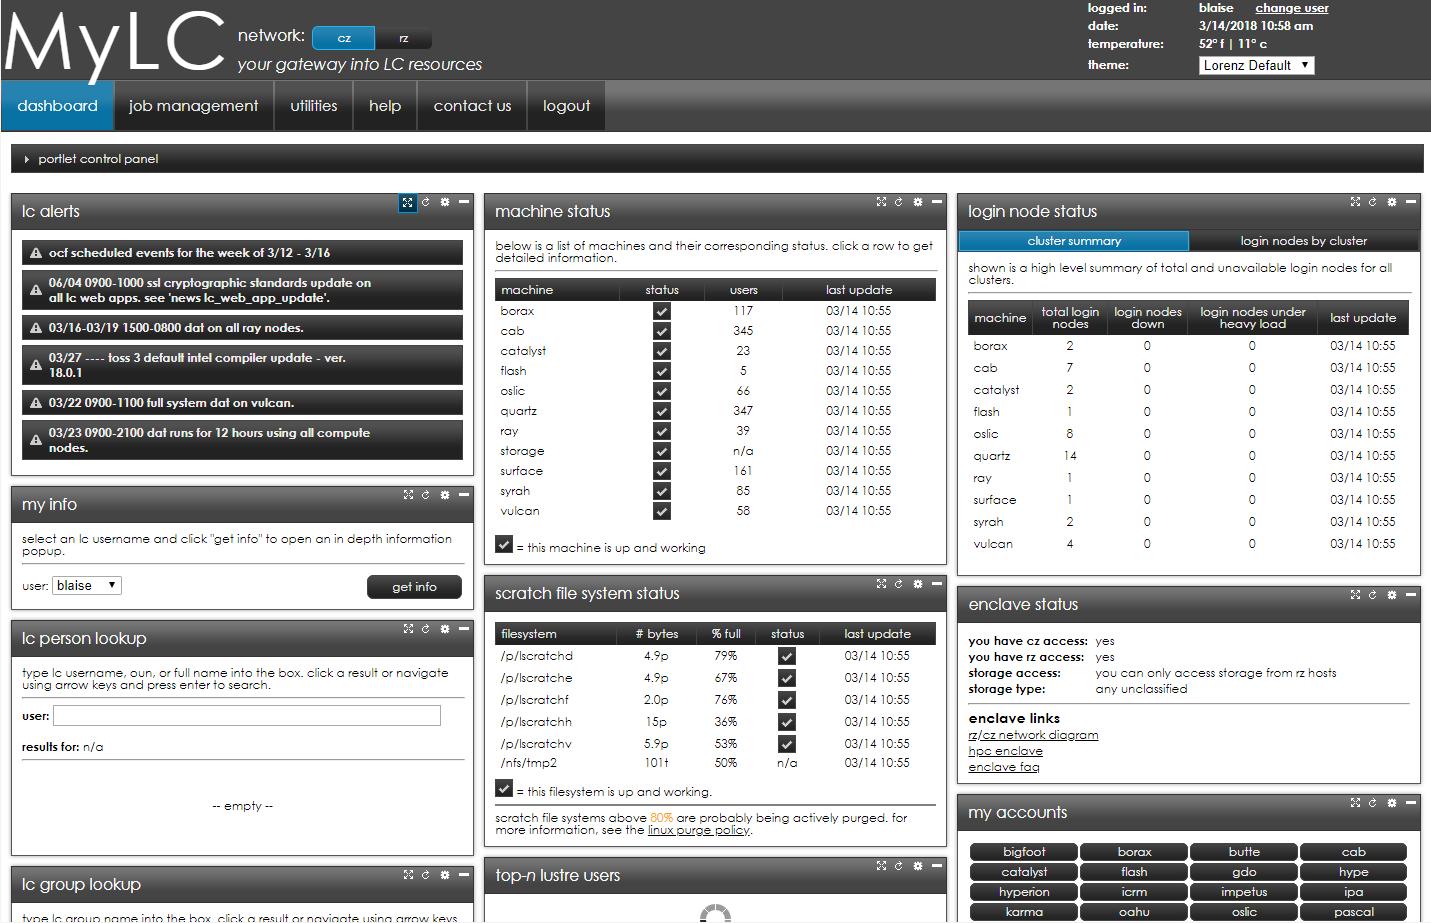
- MyLC Portal: mylc.llnl.gov
- Click on a machine name in the "machine status" portlet, or the "my accounts" portlet.
- Then select the "details", "topology" and/or "job limits" tabs for detailed hardware and configuration information.
- LC Tutorials:
- Located on the LC Homepage under the "Training" menu.
- Direct link: hpc.llnl.gov/documentation/tutorials
- Systems Summary Tables:
- LC Systems Summary: hpc.llnl.gov/sites/default/files/LC-systems-summary.pdf. Concise 1-page summary of LC production systems.
System Status Information
- LC Hardware page: hpc.llnl.gov/hardware
- Unclassified systems only
- MyLC Portal:
- mylc.llnl.gov
- Several portlets provide system status information:
- machine status
- login node status
- parallel file system status
- enclave status
- Machine status email lists:
- Provide the most timely status information for system maintenance, problems, and system changes/updates
- ocf-status covers all machines on the OCF
- Additionally, each machine has its own status list - for example: sierra-status@llnl.gov
- Login banner & news items - always displayed immediately after logging in
- Login banner includes basic configuration information, announcements and news items. Example login banner HERE.
- News items (unread) appear at the bottom of the login banner. For usage, type news -h.
- Direct links for systems and file systems status pages:
| Description | Network | Links |
|---|---|---|
| System status web pages | OCF CZ | lc.llnl.gov/cgi-bin/lccgi/customstatus.cgi |
| File systems status web pages | OCF CZ | lc.llnl.gov/fsstatus/fsstatus.cgi |
Examples
Software Overview
Development Environment Group (DEG)
- LC's Development Environment Group (DEG) provides a stable, usable, leading-edge parallel application development environment that enables users to improve the reliability and scalable performance of LLNL applications.
- DEG installs and supports the following LC software:
- Compilers and Preprocessors
- Debuggers
- Memory Tools
- Profiling Tools
- Tracing Tools
- Performance Analysis
- Correctness Tools
- Utilities
- Additionally, DEG's mission includes:
- Working to make computing tools reliable, scalable and to help users make effective use of these tools.
- Partnering with its application development user community to identify user requirements and evaluate tool effectiveness.
- Collaborating with vendors and other third party software developers to ensure a complete environment in the most cost effective way possible and meet the needs of today's code developers utilizing emerging technologies.
- DEG Home Page: computing.llnl.gov/livermore-computing/development-environment-group
TOSS Operating System
- TOSS = Tri-Laboratory Operating System Stack
- Based on Red Hat Enterprise Linux (RHEL) with modifications to support targeted HPC hardware and cluster computing
- Used by most LC (and Tri-lab) production Linux clusters:
- For Blue Gene systems, the login nodes use TOSS, but the compute nodes run a special Linux-like Compute Node Kernel (CNK).
- CORAL EA and Sierra clusters use a "TOSS-like" OS/software stack, called blueos by LC.
- The primary components of TOSS include:
- RHEL kernel optimized for large scale cluster computing
- OpenFabrics Enterprise Distribution InfiniBand software stack including MVAPICH and OpenMPI libraries
- Slurm workload manager
- Integrated Lustre and Panasas parallel file system software
- Scalable cluster administration tools
- Cluster monitoring tools
- GNU, C, C++ and Fortran90 compilers (GNU, Intel, PGI)
- Testing software framework for hardware and operating system validation
- See Redhat's documentation for details on the RHEL kernel.
- Version information for LC's clusters:
- TOSS: distro_version or cat /etc/toss-release
- Redhat: cat /etc/redhat-release
Software Lists, Documentation, and Downloads
The table below lists and provides links to the majority of software available through LC and related organizations.
| Software Category | Description and More Information |
|---|---|
| Compilers | Lists which compilers are available for each LC system: hpc.llnl.gov/software/development-environment-software/compilers |
| Supported Software and Computing Tools | Development Environment Group supported software includes compilers, libraries, debugging, profiling, trace generation/visualization, performance analysis tools, correctness tools, and several utilities: hpc.llnl.gov/software/development-environment-software |
| Graphics Software | Graphics Group supported software includes visualization tools, graphics libraries, and utilities for the plotting and conversion of data: hpc.llnl.gov/software/visualization-software |
| Mathematical Software Overview | Lists and describes the primary mathematical libraries and interactive mathematical tools available on LC machines: hpc.llnl.gov/software/mathematical-software |
| LINMath | The Livermore Interactive Numerical Mathematical Software Access Utility, is a Web-based access utility for math library software. The LINMath Web site also has pointers to packages available from external sources: www-lc.llnl.gov/linmath/ |
| Center for Applied Scientific Computing (CASC) Software | A wide range of software available for download from LLNL's CASC. Includes mathematical software, language tools, PDE software frameworks, visualization, data analysis, program analysis, debugging, and benchmarks: hpc.llnl.gov/software, computing.llnl.gov/projects |
| LLNL Software Portal | Lab-wide portal of software repositories: software.llnl.gov |
Modules
- Most LC clusters support Lmod modules for software packaging:
- Provide a convenient, uniform way to select among multiple versions of software installed on LC systems.
- Many LC software applications require that you load a particular "package" in order to use the software.
- Using Modules:
List available modules:     module avail
Load a module:              module add|load modulefile
Unload a module:            module rm|unload modulefile
List loaded modules:        module list
Read module help info:      module
Display module contents:    module display|show modulefile
- For more information see:
- LC modules documentation
- TACC documentation: LMOD: ENVIRONMENTAL MODULES SYSTEM
- The module man page
Development Tools - Confluence, JIRA, GitLab, etc.

- LC supports a suite of web-based collaboration tools:
- Confluence: wiki tool, used for documentation, collaboration, knowledge sharing, file sharing, mockups, diagrams... anything you can put on a webpage.
- JIRA: issue tracking and project management system
- GitLab: Git repository hosting, Continuous Integration, Issue tracking
- All three collaboration tools:
- Are based on LC usernames / groups and are intended to foster collaboration between LC users working on HPC projects.
- Require authentication with your LC username and RSA PIN + token
- Have a User Guide for usage information
- Locations:
| Network | Confluence Wiki | JIRA | GitLab |
|---|---|---|---|
| CZ | lc.llnl.gov/confluence/ | lc.llnl.gov/jira/ | lc.llnl.gov/gitlab/ |
| RZ | rzlc.llnl.gov/confluence/ | rzlc.llnl.gov/jira/ | rzlc.llnl.gov/gitlab/ |
| SCF | lc.llnl.gov/confluence/ | lc.llnl.gov/jira/ | lc.llnl.gov/gitlab/ |
Spack Package Manager

- Spack is a flexible package manager for HPC
- Easy to download and install. For example:
% git clone https://github.com/spack/spack
% . spack/share/spack/setup-env.csh (or setup-env.sh)
- There is an increasing number of software packages (over 4,200 as of May 2020) available for installation with Spack. Many open source contributions from the international community.
- To view available packages: spack list
- Then, to install a desired package: spack install packagename
- Additional Spack features:
- Allows installations to be customized. Users can specify the version, build compiler, compile-time options, and cross-compile platform, all on the command line.
- Allows dependencies of a particular installation to be customized extensively.
- Non-destructive installs - Spack installs every unique package/dependency configuration into its own prefix, so new installs will not break existing ones.
- Creation of packages is made easy.
- Extensive documentation is available at: spack.readthedocs.io
Compilers
Available Compilers and Invocation Commands - LC x86 systems
- The table below summarizes compiler availability and invocation commands on LC Linux clusters.
- For Sierra and CORAL EA compiler information, please see: hpc.llnl.gov/documentation/tutorials/using-lc-s-sierra-systems#compilers
- Note that parallel compiler commands are actually LC scripts that ultimately invoke the corresponding serial compiler. It is important to use the compiler wrapper scripts because they capture the correct libraries.
- For details on the MPI parallel compiler commands, see hpc-tutorials.llnl.gov/mpi
| Linux Cluster Compilers | |||
|---|---|---|---|
| Compiler | Serial Command | Parallel Commands | |
| Intel | C | icc | mpicc |
| C++ | icpc | mpicxx, mpic++ | |
| Fortran | ifort | mpif77, mpif90, mpifort | |
| GNU | C | gcc | mpicc |
| C++ | g++ | mpicxx, mpic++ | |
| Fortran | gfortran | mpif77, mpif90, mpifort | |
| PGI | C | pgcc | mpipgcc, mpicc |
| C++ | pgc++ | mpicxx, mpic++ | |
| Fortran | pgf77, pgf90, pgfortran | mpif77, mpif90, mpifort | |
| LLVM/Clang | C | clang | mpicc |
| C++ | clang++ | mpicxx, mpic++ | |
Compiler Versions and Defaults
- LC maintains multiple versions of each compiler.
- The Modules module avail command is used to list available compilers and versions:
module avail intel
module avail gcc
module avail pgi
module avail clang
- Versions: to determine the actual version you are using, issue the compiler invocation command with its "version" option. For example:
| Compiler | Option | Example |
|---|---|---|
| Intel | version | ifort --version |
| GNU | version | g++ --version |
| PGI | -V | pgf90 -V |
| Clang | --version | clang --version |
- To use an alternate version issue the Modules command: module load module-name
Compiler Options
- Each compiler has hundreds of options that determine what the compiler does and how it behaves.
- The options used by one compiler mostly differ from other compilers.
- Additionally, compilers have different default options.
- An in-depth discussion of compiler options is beyond the scope of this tutorial.
- See the compiler's documentation, man pages, and/or -help or --help option for details.
Compiler Documentation
- Intel and PGI: compiler docs are included in the /opt/compilername directory. Otherwise, see Intel or PGI web pages.
- GNU: see the web pages at gcc.gnu.org/
- LLVM/Clang: see the web pages at clang.llvm.org/docs/
- Man pages may/may not be available
Available Compilers and Invocation Commands - LC CORAL Systems
The following compilers are available on Sierra systems, and are discussed in detail below, along with other relevant compiler related information:
- XL: IBM's XL C/C++ and Fortran compilers
- Clang: IBM's C/C++ clang compiler
- GNU: GNU compiler collection, C, C++, Fortran
- PGI: Portland Group compilers
- NVCC: NVIDIA's C/C++ compiler
Compiler Recommendations
The recommended and supported compilers are those delivered from IBM (XL and Clang ) and NVIDIA (NVCC):
- Only XL and Clang compilers from IBM provide OpenMP 4.5 with GPU support.
- NVCC offers direct CUDA support
- The IBM xlcuf compiler also provides direct CUDA support
Please report all problems to the you may have with these to the LC Hotline so that fixes can be obtained from IBM and NVIDIA.
The other available compilers (GNU and PGI) can be used for experimentation and for comparisons to the IBM compilers:
- Versions installed at LC do not provide Open 4.5 with GPU support
- If you experience problems with the PGI compilers, LC can forward those issues to PGI.
- Using OpenACC on LC's Sierra clusters is not recommended nor supported.
Wrappers Scripts
- LC has created wrappers for most compiler commands, both serial and MPI versions.
- The wrappers perform LC customization and error checking. They also follow a string of links, which include other wrappers.
- The wrappers located in /usr/tce/bin (in your PATH) will always point (symbolic link) to the default versions.
Note There may also be versions of the serial compiler commands in /usr/bin. Do not use these, as they are missing the LC customizations.
- If you load a different module version, your PATH will change, and the location may then be in either /usr/tce/bin or /usr/tcetmp/bin.
- To determine the actual location of the wrapper, simply use the command which compilercommand to view its path.
Example: show location of default/current xlc wrapper, load a new version, and show new location:
% which xlc /usr/tce/packages/xl/xl-2019.02.07/bin/xlc % module load xl/2019.04.19 Due to MODULEPATH changes the following have been reloaded: 1) spectrum-mpi/rolling-release The following have been reloaded with a version change: 1) xl/2019.02.07 => xl/2019.04.19 % which xlc /usr/tce/packages/xl/xl-2019.04.19/bin/xlc
Debuggers
- Note Please consult the "Supported Software and Computing Tools" web page located at hpc.llnl.gov/software.
TotalView
- TotalView is probably the most widely used debugger for parallel programs. It can be used with C/C++ and Fortran programs and supports all common forms of parallelism, including pthreads, openMP, MPI, accelerators and GPUs.
- Starting TotalView for serial codes: simply issue the command:
totalview myprog
- Starting TotalView for interactive parallel jobs:
- Some special command line options are required to run a parallel job through TotalView under SLURM. You need to run srun under TotalView, and then specify the -a flag followed by 1) srun options, 2) your program, and 3) your program flags (in that order). The general syntax is: totalview srun -a -n #processes -p pdebug myprog [prog args]
- To debug an already running interactive parallel job, simply issue the totalview command and then attach to the srun process that started the job.
- Debugging batch jobs is covered in LC's TotalView tutorial and in the "Debugging in Batch" section below.
- Documentation:
- LC Tutorial
- Vendor website: www.roguewave.com/
DDT
- DDT stands for "Distributed Debugging Tool", a product of Allinea Software Ltd.
- DDT is a comprehensive graphical debugger designed specifically for debugging complex parallel codes. It is supported on a variety of platforms for C/C++ and Fortran. It is able to be used to debug multi-process MPI programs, and multi-threaded programs, including OpenMP.
- Currently, LC has a limited number of fixed and floating licenses.
- Usage information: see LC's DDT Quick Start information located at: hpc.llnl.gov/software/development-environment-software/allinea-ddt
- Documentation: see the vendor website: www.allinea.com
STAT - Stack Trace Analysis Tool
- The Stack Trace Analysis Tool gathers and merges stack traces from a parallel application's processes.
- STAT is particularly useful for debugging hung programs.
- It produces call graphs: 2D spatial and 3D spatial-temporal
- The 2D spatial call prefix tree represents a single snapshot of the entire application (see image).
- The 3D spatial-temporal call prefix tree represents a series of snapshots from the application taken over time.
- More information: see the STAT web page at: hpc.llnl.gov/software/development-environment-software/stat-stack-trace-analysis-tool
Other Debuggers
- Several other common debuggers are available on LC Linux clusters, though they are not recommended for parallel programs when compared to TotalView and DDT.
- PGDBG: the Portland Group Compiler debugger. Documentation: www.pgroup.com/products/pgdbg.htm
- GDB: GNU GDB debugger, a command-line, text-based, single process debugger. Documentation: www.gnu.org/software/gdb
- DDD: GNU DDD debugger is a graphical front-end for command-line debuggers such as GDB, DBX, WDB, Ladebug, JDB, XDB, the Perl debugger, the bash debugger, or the Python debugger. Documentation: www.gnu.org/software/ddd
Performance Analysis Tools
- Consult the "Development Environment Software" web pages at: hpc.llnl.gov/software/development-environment-software for what may be available here. Some example tools are listed below.
Memory Correctness Tools
Memcheck: Valgrind's Memcheck tool detects a comprehensive set of memory errors, including reads and writes of unallocated or freed memory and memory leaks.
TotalView: Allows you to stop execution when heap API problems occur, list memory leaks, paint allocated and deallocated blocks, identify dangling pointers, hold onto deallocated memory, graphically browse the heap, identify the source line and stack backtrace of an allocation or deallocation, summarize heap use by routine, filter and dump heap information, and review memory usage by process or by library.
memP: The memP tool provides heap profiling through the generation of two reports: a summary of the heap high-water-mark across all processes in a parallel job as well as a detailed task-specific report that provides a snapshot of the heap memory currently in use, including the amount allocated at specific call sites.
Intel Inspector: Primarily a thread correctness tool, but memory debugging features are included.
Profiling, Tracing, and Performance Analysis

Open|SpeedShop: Open|SpeedShop is a comprehensive performance tool set with a unified look and feel that covers most important performance analysis steps. It offers various different interfaces, including a flexible GUI, a scripting interface, and a Python class. Supported experiments include profiling using PC sampling, inclusive and exclusive execution time analysis, hardware counter support, as well as MPI, I/O, and floating point exception tracing. All analysis is applied on unmodified binaries and can be used on codes with MPI and/or thread parallelism.
TAU: TAU is a robust profiling and tracing tool from the University of Oregon that includes support for MPI and OpenMP. TAU provides an instrumentation API, but source code can also be automatically instrumented and there is support for dynamic instrumentation as well. Experienced users have applied the tool with good results at LLNL. TAU can be configured with many feature combinations.
HPCToolkit: HPCToolkit is an integrated suite of tools for measurement and analysis of program performance on computers ranging from multicore desktop systems to the largest supercomputers. It uses low overhead statistical sampling of timers and hardware performance counters to collect accurate measurements of a program's work, resource consumption, and inefficiency and attributes them to the full calling context in which they occur. HPCToolkit works with C/C++/Fortran applications that are either statically or dynamically linked. It supports measurement and analysis of serial codes, threaded codes (pthreads, OpenMP), MPI, and hybrid (MPI + threads) parallel codes.
mpiP: A lightweight MPI profiling library that provides time spent in MPI functions by callsite and stacktrace. This tool is developed and maintained at LLNL, so support and modifications can be quickly addressed. New run-time functionality can be used to generate mpiP data without relinking through the srun-mpip and poe-mpip scripts on Linux and AIX systems.
gprof: Displays call graph profile data. The gprof command is useful in identifying how a program consumes CPU resources. Gprof does simple function profiling and requires that the code be built and linked with -pg. For parallel programs, in order to get a unique output file for each process, you will need to set the undocumented environment variable GMON_OUT_PREFIX to some non-null string. For example: setenv GMON_OUT_PREFIX 'gmon.out.'`/bin/uname -n`
pgprof: PGI profiler - pgprof is a tool which analyzes data generated during execution of specially compiled programs. This information can be used to identify which portions of a program will benefit the most from performance tuning.
PAPI: Portable hardware performance counter library.
PapiEx: A PAPI-based performance profiler that measures hardware performance events of an application without having to instrument the application.
VTune Amplifier: The Intel VTune Amplifier tool is a performance analysis tool for finding hotspots in serial and multithreaded codes. Note the installation on LC machines does not include the advanced hardware analysis capabilities.
Intel Profiler: The Intel Profiler tool is built into the Intel compiler along with a simple GUI to display the collected results.
Vampir / Vampirtrace: Full featured trace file visualizer and library for generating trace files for parallel programs.
PART II: Running Jobs
Basic Concepts
Jobs
Simple Definition
- To a user, a job can be simply described as a request for compute resources needed to perform computational work.
- Jobs typically specify what resources are needed, such as:
- Which cluster
- Number of nodes
- Length of time
- Queue to use
- Account to charge
- ...
- Jobs are typically submitted to the Workload Manager by means of a job script. Job scripts are discussed in the Building a Job Script section.
Interactive vs Batch
Batch
- Refers to jobs that you submit to the workload manager via a job script.
- After submitting, you typically wait for your job to be scheduled and then run; typically no command line interacting via stdin, stdout.
- The vast majority of jobs on LC clusters are batch jobs.
- Most of the remaining material in this tutorial applies to batch jobs.
Interactive
- Refers to jobs that you launch and interact with real-time from the command line (stdin, stdout).
- Do not require a job script
- Most often (but not always) used for small, short, debugging / testing runs.
- Interactive jobs are discussed further in the: Interactive Jobs section.
Serial vs Parallel
- Parallel jobs can range in size from a single node (multi-core) to the full system.
- All but a few of LC's production clusters are intended to be used for parallel jobs.
- Serial jobs by definition require only one core on a node.
- Because running serial jobs on parallel clusters would waste compute resources, LC provides several clusters where serial jobs can be run without wasting compute resources.
Queues and Queue Limits
Queues (also called Pools and/or Partitions)
- The majority of nodes on LC's production systems are designated as compute nodes.
- Compute nodes are typically divided into queues / pools / partitions based upon how they should be used.
Batch queue
- Typically comprises most of the compute nodes on a system
- Named pbatch
- Intended for production work
- Configured on all but a few LC systems
Interactive/debug queue
- Typically comprises a small number of the compute nodes on a system
- Named pdebug
- Intended for small, short-running interactive and debugging work (not production)
- Configured on most LC systems
OTHER QUEUES
- There may be other queues on some machines, such as the viz, pviz, pgpu, etc.
- There are defined limits for each queue, the most important being:
- Max/min number of nodes permitted for a job
- Max wall-clock time - how long a job is permitted to run
- Max number of simultaneous running jobs or max number of nodes permitted across all running jobs.
- No two LC systems have the same queue limits.
- Queue limits can and do change!
- Notes:
- To run jobs that exceed queue limits, users can request Dedicated Application Time (DAT).
- Login nodes are a shared, limited resource not intended for production work. They are not associated with any queue.
How Do I Find Out What the Queue Limits Are?
- The easiest way to determine the queue configuration and limits for a particular machine is to login to that machine and use the command:
news job.lim.quartz - This is the same information available in the LC "Machine Status" web pages: (LC internal). Click on the machine name of interest and then look for the "Job Limits" link.
- It is also available on the "MyLC" web pages. Just click on any machine name in the "machine status" or "my accounts" portlets. Then select the "job limits" tab.
- OCF-CZ: mylc.llnl.gov
- For convenience, the queue limits for all of LC's production clusters are summarized below, as of June 2019. All information is subject to change.
Banks
Bank Hierarchy
- In order to run in a queue, whether batch or interactive on a cluster, you need to have two things:
- Login account: your username appears in /etc/passwd
- LC bank: your username is associated with a valid LC bank
Basic Functions
Building a Job Script
The Basics
- Users submit jobs to the Workload Manager for scheduling by means of a job script.
- A job script is a plain text file that you create with your favorite editor.
- Job scripts can include any/all of the following:
- Commands, directives and syntax specific to a given batch system
- Shell scripting
- References to environment variables
- Names of executable(s) to run
- Comment lines and white space
- Simple Slurm and Moab job control scripts appear below:
| Slurm |
|---|
#!/bin/tcsh ##### These lines are for Slurm #SBATCH -N 16 #SBATCH -J parSolve34 #SBATCH -t 2:00:00 #SBATCH -p pbatch #SBATCH --mail-type=ALL #SBATCH -A myAccount #SBATCH -o /p/luster1/joeuser/par_solve/myjob.out ##### These are shell commands date cd /p/luster1/joeuser/par_solve ##### Launch parallel job using srun srun -n128 a.out echo 'Done' |
Options
- There are a wide variety of options that can be used in your job script. Some of the more common/useful options are shown below.
| Slurm | Description/Notes |
|---|---|
#SBATCH -A account |
Defines the account (bank) associated with the job. |
#SBATCH --begin=time |
Declares the time after which the job is eligible for execution. See man page for syntax. |
#SBATCH -c # |
cpus/cores per task |
#SBATCH -d list |
Specify job dependencies. |
#SBATCH -D path |
Specifies the directory in which the job should begin executing. |
#SBATCH -e filename |
Specifies the file name to be used for stderr. |
#SBATCH --export=list |
Specifically adds a list (comma separated) of environment variables that are exported to the job. |
#SBATCH --license=filesystem |
Job requires the specified parallel Lustre file system(s). Valid labels are the names of mounted Lustre parallel file systems, such as lustre1, lustre2. The purpose of this option is to prevent jobs from being scheduled if the specified file systems are unavailable. |
#SBATCH -H |
Put a user hold on the job at submission time. |
#SBATCH -i filename |
Specifies the file name to be used for stdin. |
#SBATCH -J name |
Gives a user specified name to the job. |
default |
Combine stdout and stderr into the same output file. This is the default. If you want to give the combined stdout/stderr file a specific name, include the -o flag also. |
#SBATCH --mail-type=type (begin, end, fail, requeue, all) |
Defines when a mail message about the job will be sent to the user. See the man page for details. |
#SBATCH -N # |
Node count |
#SBATCH -n # #SBATCH --ntasks-per-node=# #SBATCH --tasks-per-node=# |
Task count |
#SBATCH --nice=value |
Assigns a user priority value to a job. |
#SBATCH -o filename |
Defines the file name to be used for stdout. |
#SBATCH -p partition |
Run the job in the specified partition/queue (pdebug, pbatch, etc.). |
#SBATCH --qos=exempt #SBATCH --qos=expedite #SBATCH --qos=standby |
Defines the quality-of-service to be used for the job. |
#SBATCH --requeue #SBATCH --no-requeue |
Specifies whether or not to rerun the job is there is a system failure. The default behavior at LC is to NOT automatically rerun a job in such cases. |
|
|
Specifies the shell which interprets the job script. The default is your login shell. |
#SBATCH --signal=14@120 #SBATCH --signal=SIGHUP@2:00 |
Signaling - specifies the pre-termination signal to be sent to a job at the desired time before expiration of the job's wall clock limit. Default time is 60 seconds. |
#SBATCH -t time |
Specifies the wall clock time limit for the job. See the man page for syntax. |
#SBATCH --export=ALL |
Declares that all environment variables in the job submission environment are exported to the batch job. |
Submitting Jobs
Job Submission Commands
- The sbatch and msub commands are used to submit your job script to the Workload Manager. Upon successful submission, the job's ID is returned and it is spooled for execution.
- These commands accept the same options as the #SBATCH / #MSUB tokens in a batch script.
- Examples:
Slurm % sbatch myjobscript Submitted batch job 645133 % sbatch -p pdebug -A physics myjobscript Submitted batch job 645134
Usage Notes
- Both sbatch and msub are available on LC SLURM clusters:
- Use sbatch to submit job scripts with #SBATCH syntax
- Use msub to submit job scripts with #MSUB syntax
- After you submit your job script, changes to the contents of the script file will have no effect on your job because it has already been spooled to system file space.
- Users may submit and queue as many jobs as they like, up to a reasonable configuration defined limit. The actual number of running jobs per user is usually a lower limit, however. These limits can vary between machines.
- The default directory is where you submit your job from. If you need to be in another directory, then you will need to explicitly cd to, or set the working directory with an #SBATCH / #MSUB option.
Monitoring Jobs
checkjob
- Displays detailed job state information and diagnostic output for a selected job.
- Detailed information is available for queued, blocked, active, and recently completed jobs.
- The checkjob command is probably the most useful user command for troubleshooting your job, especially if used with the -v and -v -v flags.
- Common/useful options:
- -v shows additional information
- -v -v shows additional information plus job script (if available)
- Checkjob man page HERE
- Examples below:
% checkjob 650263
job 650263

AName: vasp_NEB_inter_midbot_t2
State: Running
Creds:  user:vuiuey2  group:vuiuey2  account:ioncond  class:pbatch  qos:normal
WallTime:  01:53:43 of 06:00:00
SubmitTime: Thu May 11 06:50:30
  (Time Queued Total:  1:49:46   Eligible:  1:49:46)

StartTime: Thu May 11 08:40:16
Total Requested Tasks:  1
Total Requested Nodes:  10
Partition: pbatch
Dedicated Resources Per Task: luster1
Node Access: SINGLEJOB
NodeCount: 10

Allocated Nodes:
quartz[52,362-363,398-399,444-445,2648-2650]

SystemID:  quartz
SystemJID: 650263
IWD:        /p/luster1/vuiuey2/calculations/radiation/V_Br/NEB_inter_midbot_t2
Executable: /p/luster1/vuiuey2/calculations/radiation/V_Br/NEB_inter_midbot_t2/psub.vasp

User Specified Partition List:    quartz
System Available Partition List:  quartz
Partition List: quartz
StartPriority: 1000031
Banks and Usage Information
Overview
- As discussed previously, in order to run on a cluster, you need to have two things:
- Login account: your username appears in /etc/passwd
- Bank: your username is associated with a valid bank
- Banks are hierarchical and determine the percentage of machine resources (cycles) you are entitled to receive, as discussed in the Banks section of this tutorial.
- Every cluster has its own unique bank structure. To view the entire bank hierarchy, use the command:
mshare -t root
- You may have an allocation in more than one bank.
- If you belong to more than one bank, your banks are not necessarily shared across all of the clusters where you have a login account.
-
You have a default bank on each cluster, which may/may not be the same on other clusters.
mshare
- Displays bank structure, allocations and usage information
- If you want to see your available banks and usage stats for a cluster, this is the best command to use.
- This is also the best command for viewing your place within the entire bank hierarchy.
- mshare man page HERE
sreport
- Reports usage information for a cluster, bank, individual, date range, and more.
- sreport man page HERE
- Example: show usage by user (in hours) for the alliance bank on the cluster cab between the dates shown.
% sreport -t hours cluster AccountUtilizationByUser accounts=alliance cluster=cab  start=2/1/12 end=3/1/12

--------------------------------------------------------------------------------
Cluster/Account/User Utilization 2012-02-01T00:00:00 - 2012-02-29T23:59:59 (2505600 secs)
Time reported in CPU Hours
--------------------------------------------------------------------------------
  Cluster         Account     Login     Proper Name       Used
--------- --------------- --------- --------------- ----------
     cab         alliance                              2739237
     cab          caltech                               500080
     cab          caltech   br4e33t        Joe User     500076
     cab          caltech   sthhhd6       Bill User          4
     cab         michigan                               844339
     cab         michigan  dhat67s        Mary User       261
     cab         michigan  hetyyr2         Sam User     38552
...
...
Output Files
Defaults
- The batch output file is named slurm-jobid.out
- stdout and stderr are combined into the same batch output file.
- Will be written to the directory where you issued the sbatch or msub command.
- The name of a job has no effect on the name of the output file.
- If an output file with the same name already exists, new output will append to it.
Estimating When Your Job Will Start
- One of the most frequently asked questions is "When will my job start?".
- Because job scheduling is dynamic, and can change at any moment, picking an exact time is often impossible.
- There are a couple ways that you can get an estimate on when your job will start, based on the current situation.
- The easiest way is to use the checkjob command. Look for the StartTime line - if it exists. Note that not all jobs will show a start time.
- For example:
% checkjob 830063
job 830063

AName: OSU_IMPI51_ICC_64_run_2
State: Idle
Creds:  user:e889till  group:e889till  account:asccasc  class:pbatch  qos:normal
WallTime:  00:00:00 of 01:00:00
SubmitTime: Wed Jun 14 09:12:48
  (Time Queued Total:  5:06:19   Eligible:  5:06:19)

StartTime: Thu Jun 15 00:02:00
Total Requested Tasks:  1
Total Requested Nodes:  64
Partition: pbatch
Dedicated Resources Per Task: ignore
Node Access: SINGLEJOB
NodeCount: 64

SystemID:  quartz
SystemJID: 830063
IWD:        /g/g91/e889till/batcher
Executable: /g/g91/e889till/batcher/quartz.job

User Specified Partition List:    quartz
System Available Partition List:  quartz
Partition List: quartz
StartPriority: 1000147

NOTE: job can not run because there are higher priority jobs.
- Sometimes the squeue --start command can be used to get an estimate for job start times (and sometimes it can't). For example:
% sprio -l  |  sort -r -k 4,4
  JOBID  PARTITION  USER   PRIORITY        AGE  FAIRSHARE    JOBSIZE  PARTITION        QOS   NICE
 830811  pbatch   aaarg2    1321517          0     321517          0          0    1000000      0
 830760  pbatch    saaa4    1189400          6     189394          0          0    1000000      0
 830759  pbatch    saaa4    1189400          6     189394          0          0    1000000      0
 830776  pbatch    saaa4    1189397          3     189394          0          0    1000000      0
 830775  pbatch    ddwa9    1189397          3     189394          0          0    1000000      0
 830774  pbatch    rrra8    1189397          3     189394          0          0    1000000      0
...

 830366  pbatch  zhhhh49    1000127        127          0          0          0    1000000      0
 830365  pbatch  taffhh2    1000127        128          0          0          0    1000000      0
 830369  pbatch  zhhhh49    1000125        125          0          0          0    1000000      0
 830493  pbatch  wwwg102    1000102         86         16          0          0    1000000      0
 830576  pbatch  jjjtega    1000090         31         60          0          0    1000000      0
 830810  pbatch e988till    1000000          0          0          0          0    1000000      0
 829743  pbatch  yyymel2    1000000          0          0          0          0    1000000      0
- Sometimes the squeue --start command can be used to get an estimate for job start times (and sometimes it can't). For example:
% squeue --start
  JOBID PARTITION     NAME     USER  ST           START_TIME  NODES NODELIST(REASON)
2173337    pbatch  job.txt  is456i1  PD  2017-06-28T15:31:58      1 (Priority)
2173338    pbatch  job.txt  is456i1  PD  2017-06-28T15:36:02      1 (Priority)
2173339    pbatch  job.txt  is456i1  PD  2017-06-28T16:25:37      1 (Priority)
2173340    pbatch  job.txt  is456i1  PD  2017-06-28T16:26:37      1 (Priority)
2173341    pbatch  job.txt  is456i1  PD  2017-06-28T16:35:37      1 (Priority)
...
2174947    pbatch S180_10p bbbmons3  PD  2017-07-03T19:28:33      1 (Priority)
1247698    pdebug ppmd_IA6   vvvang  PD                  N/A      2 (PartitionNodeLimit)
1863133    pbatch    runme   tttite  PD                  N/A      4 (PartitionNodeLimit)
2156487    pbatch surge110 mrtrang1  PD                  N/A      1 (Dependency)
2163499    pbatch      voh mrtrang1  PD                  N/A      1 (Dependency)
- You can also view the position of your job in the queue relative to other jobs. Either of the commands below will give you a list of idle jobs sorted by priority - highest priority is at the top of the list.
sprio -l | sort -r -k 4,4 mdiag -p -v | sort -r -k 4,4 - For example (some output deleted to fit screen):
% sprio -l  |  sort -r -k 4,4
  JOBID  PARTITION  USER   PRIORITY        AGE  FAIRSHARE    JOBSIZE  PARTITION        QOS   NICE
 830811  pbatch   aaarg2    1321517          0     321517          0          0    1000000      0
 830760  pbatch    saaa4    1189400          6     189394          0          0    1000000      0
 830759  pbatch    saaa4    1189400          6     189394          0          0    1000000      0
 830776  pbatch    saaa4    1189397          3     189394          0          0    1000000      0
 830775  pbatch    ddwa9    1189397          3     189394          0          0    1000000      0
 830774  pbatch    rrra8    1189397          3     189394          0          0    1000000      0
...

 830366  pbatch  zhhhh49    1000127        127          0          0          0    1000000      0
 830365  pbatch  taffhh2    1000127        128          0          0          0    1000000      0
 830369  pbatch  zhhhh49    1000125        125          0          0          0    1000000      0
 830493  pbatch  wwwg102    1000102         86         16          0          0    1000000      0
 830576  pbatch  jjjtega    1000090         31         60          0          0    1000000      0
 830810  pbatch e988till    1000000          0          0          0          0    1000000      0
 829743  pbatch  yyymel2    1000000          0          0          0          0    1000000      0
Parallel Jobs and the srun Command
srun Command
- The Slurm srun command is required to launch parallel jobs - both batch and interactive.
- It should also be used to launch serial jobs in the pdebug and other interactive queues.
- Syntax:
srun [option list] [executable] [args]
Note that srun options must precede your executable.
-
Interactive use example, from the login node command line. Specifies 2 nodes (-N), 72 tasks (-n) and the interactive pdebug partition (-p):
% srun -N2 -n72 -ppdebug myexe
- Batch use example requesting 16 nodes and 576 tasks (assumes nodes have 36 cores):
| Slurm |
|---|
| First create a job script that requests nodes and uses srun to specify the number of tasks and launch the job: |
#!/bin/tcsh #SBATCH -N 16 #SBATCH -t 2:00:00 #SBATCH -p pbatch # Run info and srun job launch cd /p/luster1/joeuser/par_solve srun -n576 a.out echo 'Done' |
| Then submit the job script from the login node command line: |
% sbatch myjobscript |
- Primary differences between batch and interactive usage:
| Difference | Interactive | Batch |
|---|---|---|
| Where used: | From login node command line | In batch script |
| Partition: | Requires specification of an interactive partition, such as pdebug with the -p flag | pbatch is default |
| Scheduling: | If there are available interactive nodes, job will run immediately. Otherwise, it will queue up (fifo) and wait until there are enough free nodes to run it. | The batch scheduler handles when to run your job regardless of the number of nodes available. |
- More Examples:
srun -n64 -ppdebug my_app
64 process job run interactively in pdebug partition
srun -N64 -n512 my_threaded_app
512 process job using 64 nodes. Assumes pbatch partition.
srun -N4 -n16 -c4 my_threaded_app
4 node, 16 process job with 4 cores (threads) per process. Assumes pbatch partition.
srun -N8 my_app
8 node job with a default value of one task per node (8 tasks). Assumes pbatch partition.
srun -n128 -o my_app.out my_app
128 process job that redirects stdout to file my_app.out. Assumes pbatch partition.
srun -n32 -ppdebug -i my.inp my_app
32 process interactive job; each process accepts input from a file called my.inp instead of stdin
Task Distribution and Binding for Batch Jobs:
- The LC default is for the scheduler to distribute tasks as evenly as possible across the allocated nodes.
- Examples: if 4 nodes (with 16 cores each) are requested by a batch job using:
#SBATCH -N 4
#MSUB -l nodes=4
- then the behavior of srun -N and -n flags will be as follows:
- Additionally, tasks are bound to specific cores to promote better cache utilization.
- Threads associated with a task are likewise bound to the same cores.
srun Options
- srun is a powerful command with many (> 100 options) affecting a wide range of job parameters.
- For example:
- Accounting
- Number and placement of processes/threads
- Process/thread binding
- Job resource requirements; dependencies
- Mail notification options
- Input, output options
- Time limits
- Checkpoint, restart options
- and much more....
- Some srun options may be set via Slurm environment variables. For example, SLURM_NNODES behaves like the -N option.
- See the srun man page for details.
Parallel Output
- Please use a parallel file system for parallel I/O. Lustre parallel file systems are mounted under /p/lustre#.
- It's a good idea to launch parallel jobs from a parallel file system even if they aren't doing much I/O. A core dump on a parallel job can hang a non-parallel file system easily.
Running Multiple Jobs From a Single Job Script
Motivation
- Combining multiple jobs into a single job script means there is only one wait in the queue for the entire job group.
Sequential
- If one job is dependent upon the completion of a previous job, then this method can be used.
- When you submit your job script, be sure to specify enough wall clock time to cover all of the included jobs.
- Individual jobs can vary in the number of nodes used, provided none of them exceed the number of nodes allocated to your encompassing job script.
Example below. Assumes 36 cores per node: 16 nodes * 36 cores = 576 tasks max.
| Slurm |
|---|
#!/bin/tcsh #SBATCH -N 16 #SBATCH -t 12:00:00 srun -n576 myjob1 srun -n576 myjob2 srun -N16 -n288 myjob3 srun -N12 -n432 myjob4 |
Simultaneous
- This method can be used if there are no dependencies between jobs.
- When you submit your job script, be sure to specify enough nodes to cover all of the included jobs.
- You can vary the number of nodes used by individual jobs as long as the aggregate number of nodes doesn't exceed the number of nodes allocated to your encompassing job script.
- Important to remember:
- Put each individual job "in the background" using an ampersand - otherwise they will run sequentially.
- Include a wait statement to ensure the job script doesn't terminate prematurely.
- With your srun commands, be sure to explicitly specify how many nodes each job requires - or else the scheduler will think each job has access to all nodes, with possible complications.
Example 1: every job uses the same number of nodes/tasks.
Assumes 36 cores per node: 16 nodes * 36 cores = 576 tasks max.
| Slurm |
|---|
#!/bin/tcsh #SBATCH -N 16 #SBATCH -t 12:00:00 srun -N4 -n144 myjob1 & srun -N4 -n144 myjob2 & srun -N4 -n144 myjob3 & srun -N4 -n144 myjob4 & wait |
- Example 2: jobs differ in the number of nodes/tasks used.
Assumes 36 cores per node: 16 nodes * 36 cores = 576 tasks max.
| Slurm |
|---|
#!/bin/tcsh #SBATCH -N 16 #SBATCH -t 12:00:00 srun -N4 -n144 myjob1 & srun -N2 -n72 myjob2 & srun -N8 -n8 myjob3 & srun -N2 -n16 myjob4 & wait |
Interactive Jobs
Interactive Jobs - SLURM
- Refers to batch jobs that you launch and interact with real-time from the command line.
- Don't use Login Nodes (in most cases):
- Login nodes are shared, oftentimes by many users.
- Intended for non-cpu intensive interactive tasks, such as editing, working with files, running GUIs, browsers, debuggers, etc.
- Not intended for running CPU-intensive production jobs, which can negatively impact other users.
- Most clusters have a pdebug partition of compute nodes dedicated to small, short, interactive jobs. Another common interactive partition is pvis.
- There are several ways to run interactive jobs on LC's Linux clusters, as described below.
- Method 1: Use srun on a login node specifying compute nodes in the pdebug or other interactive partition.
- To view the partitions on a cluster use the sinfo -s command. It shows which partitions are configured, their time limit and how the nodes are currently being used (Allocated / Idle / Other / Total). For example, on Quartz note the pdebug partition:
% sinfo -s
PARTITION AVAIL  TIMELIMIT   NODES(A/I/O/T)  NODELIST
pdebug       up      30:00       20/26/0/46  quartz[1-46]
pbatch*      up 1-00:00:00  2865/52/13/2930  quartz[47-186,193-378,...,2887-3072]
pall       down   infinite  2885/78/13/2976  quartz[1-186,193-378,...,2887-3072]
- Then use the srun command to run the job on compute nodes in pdebug. For example, to run your executable on 2 pdebug nodes using 16 tasks:
% srun -p pdebug -N 2 -n 16 myexe
- To view the partitions on a cluster use the sinfo -s command. It shows which partitions are configured, their time limit and how the nodes are currently being used (Allocated / Idle / Other / Total). For example, on Quartz note the pdebug partition:
- Method 2: Use salloc to acquire compute nodes for interactive use.
- On a login node, request an allocation of compute nodes, and optionally the partition to acquire them from. The default is usually pbatch, but small short jobs usually get better turnaround time in pdebug. For example, to request 2 pdebug compute nodes:
% salloc -p pdebug -N 2
salloc: Pending job allocation 3891090
salloc: job 3891090 queued and waiting for resources
salloc: job 3891090 has been allocated resources
salloc: Granted job allocation 3891090
- After your allocation is granted, you will be placed on the first node of the allocation. You can verify this as follows:
% squeue -u joeuser
  JOBID PARTITION     NAME      USER ST       TIME  NODES NODELIST(REASON)
3891090    pdebug       sh   joeuser  R       0:07      2 quartz[1-2]
% hostname
quartz1
- You can now run whatever you'd like interactively on your job's compute nodes.
- On a login node, request an allocation of compute nodes, and optionally the partition to acquire them from. The default is usually pbatch, but small short jobs usually get better turnaround time in pdebug. For example, to request 2 pdebug compute nodes:
- Method 3: Use sxterm / mxterm to acquire compute nodes for interactive use.
- Similar to salloc, but different because it will actually "behind the scenes" create a batch job for your request, queue it and then when it starts to run on a compute node, pop open an xterm window on your desktop.
- For example requesting 1 node / 1 task / for 30 minutes in the pdebug partition:
% sxterm 1 1 30 -p pdebug
Submitted batch job 3048379
- Wait until the xterm window appears on your desktop. You will be on the first node of your job's allocation and can run whatever you'd like interactively.
- There's no man page - just invoke "sxterm" with no options and a usage message will display.
- The mxterm command is similar, with different options. Just invoke "mxterm" for usage information.
- Method 4: Submit a batch job and then rsh/ssh to the compute nodes where it is running.
- You can submit a batch job (covered next) that really doesn't do anything except "sleep."
- The squeue command can be used to show when and where your job is running.
- After it starts running, you can rsh or ssh to any of its compute nodes.
- Once on a compute node, you can run whatever you'd like interactively.
- Important usage notes about the pdebug partition:
- As the name pdebug implies, interactive jobs should be short, small debugging jobs, not production runs.
- Shorter time limit
- Fewer number of nodes permitted
- There is usually a "good neighbor" policy in effect - don't monopolize the queue or setup streams of jobs
Interactive Jobs - LSF
There are two main "flavors" of interactive jobs:
- Pseudo-terminal shell - uses your existing SSH login window
- Xterm - launches a new window using your default login shell
The LSF bsub command, and the LC lalloc command can both be used for interactive jobs.
Examples:
Starting a pseudo-terminal interactive job using bsub:
From a login node, the bsub command is used to request 4 nodes in an Interactive pseudo-terminal, X11 Forwarding, Wall clock limit of 10 minutes, in a tcsh shell. After the dispatch the interactive session starts on the first compute node (by default). The bquery -X command is used to display the compute nodes allocated for this job.
bsub -nnodes 4 -Ip -XF -W 10 /bin/tcsh

Job <206798> is submitted to default queue <pdebug>.

<<ssh X11 forwarding job>>

<<Waiting for dispatch ...>>

<<Starting on rzansel62>>
Starting a pseudo-terminal interactive job using lalloc:
This same action can be performed more simply using LC's lalloc command. Note that by default, lalloc will use the first compute node as a private launch node. For example:
lalloc 4 + exec bsub -nnodes 4 -Is -XF -W 60 -core_isolation 2 /usr/tce/packages/lalloc/lalloc-2.0/bin/lexec

Job <281904> is submitted to default queue <pbatch>.

<<ssh X11 forwarding job>>

<<Waiting for dispatch ...>>

<<Starting onlassen4370>> <<Waiting for JSM to become ready ...>>

<<Redirecting to compute nodelassen1214, setting up as private launch node>>

lassen1214%
More Information - LC Documentation and Tutorials
- Using LC's Sierra/CORAL Systems
- LSF Quick Start - hpc.llnl.gov/banks-jobs/running-jobs/lsf-quick-start-guide
- Slurm and Moab Tutorial - hpc.llnl.gov/banks-jobs/running-jobs/slurm-and-moab
- Livermore Computing Resources and Environment - hpc.llnl.gov/documentation/tutorials/livermore-computing-resources-and-environment
- Batch System Cross Reference Guide - hpc.llnl.gov/banks-jobs/running-jobs/batch-system-cross-reference-guides