An official website of the United States government
Here's how you know
Official websites use .gov A .gov website belongs to an official government organization in the United States.
Secure .gov websites use HTTPS A lock () or https:// means you’ve safely connected to the .gov website. Share sensitive information only on official, secure websites.
It is quite likely that your shell's core file size setting may limit the size of a core file so that it is inadequate for debugging, especially with TotalView.
To check your shell's limit settings, use either the limit (csh/tcsh) or ulimit -a (sh/ksh/bash) command. For example:
To override your default core file size setting, use one of the following commands:
csh/tcsh
unlimit -or- limit coredumpsize 64
sh/ksh/bash
ulimit -c 64
Some users have complained that for many-process jobs, they actually don't want core files or only want small core files because normal core files can fill up their disk space. The limit (csh/tcsh) or ulimit -c (sh/ksh/bash) commands can be used as shown above to set smaller / zero sizes.
Keep in mind that smaller core files may not be effectively used with TotalView.
How to View a Core File
TotalView can be used to examine the core file from a crashed job. Use any of the following methods to accomplish this.
Method 1:
Start totalview from the command line, supplying the executable name and the core file name:
totalview executable corefile
A new Process Window will appear, showing the state of the process when it crashed. You can then examine all program variables and the stack contents.
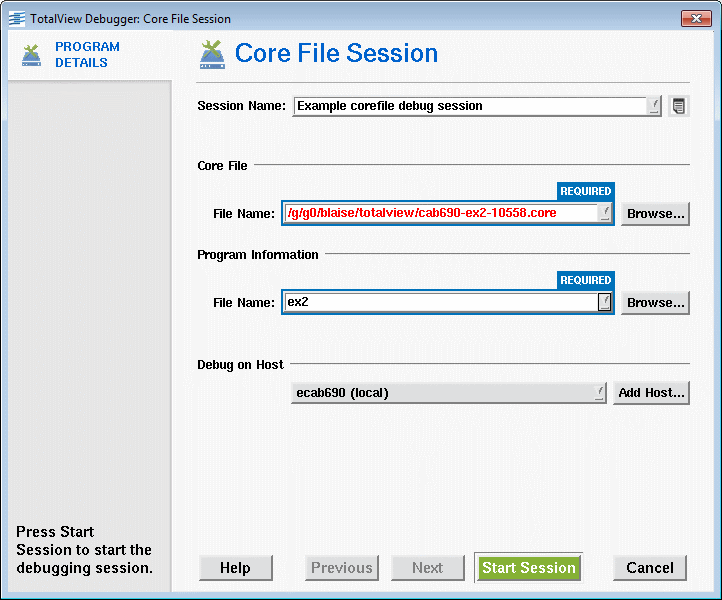
The Core File Session Dialog Box (shown below) will appear.
Enter the executable name and the core file name in the boxes provided and click Start Session. A new Process Window will appear, showing the state of the process when it crashed. You can then examine all program variables and the stack contents.
Core file session dialog box
Method 3:
Start totalview from the command line without any arguments:
totalview
The Session Manager window will appear. Select to debug A core file
After the core file has been loaded into the Process Window, you can examine the state (variables, stack, etc.) of the program when it crashed. You cannot run the program, per se, just examine the post-mortem dump.
The program counter will usually point to the statement where the program crashed.
An example of viewing a crashed program is provided below.
Example of viewing a crashed program
Core File Size
It is quite likely that your shell's core file size setting may limit the size of a core file so that it is inadequate for debugging, especially with TotalView.
To check your shell's limit settings, use either the limit (csh/tcsh) or ulimit -a (sh/ksh/bash) command. For example:
The Program Session Dialog Box will appear (below). Enter the name of the executable in the box provided, and click OK. A Process Window containing the newly loaded process will then appear allowing you to debug as usual.
Program session dialog box
Reloading a Recompiled Executable
If you make modifications to your source code and recompile it, TotalView will attempt to load the new source automatically the next time you load/run your program. If TotalView cannot find your modified source, you will have to load it yourself.
Expression Evaluation and Code Fragments
Code Fragments
TotalView enables you to enter "code fragments" during a debugging session. Code fragments can include a mixture of:
C, Fortran or Assembler language code (Note: assembler support is architecture dependent).
Code fragments interact with your program, and are evaluated within its runtime context. They can therefore be used for a variety of purposes, such as:
Setting conditional breakpoints
Program patching - branching around code and/or adding new code
Effecting conditional execution
Displaying program data
Modifying program data
Code fragments can be entered by two methods, each serving a different purpose:
In the Evaluate Window, select the language of choice (C, Fortran, Assembler) if needed.
Enter your code fragment in the Expression box.
Click on the Evaluate button. The expression will be evaluated, and its value will appear in the Result box. Note that the value that appears relates to the last expression in the code fragment, in this case "sum".
Evaluate window
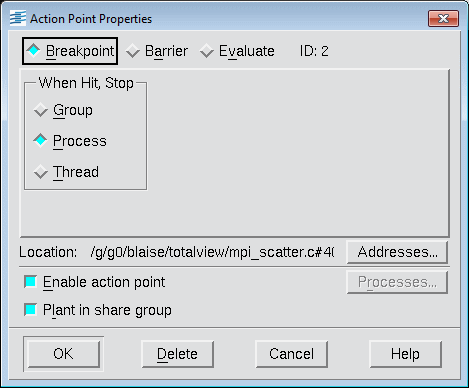
More on Action Points
Types of Action Points
TotalView supports four different types of action points:
Breakpoint: stops execution of the processes or threads that reach it.
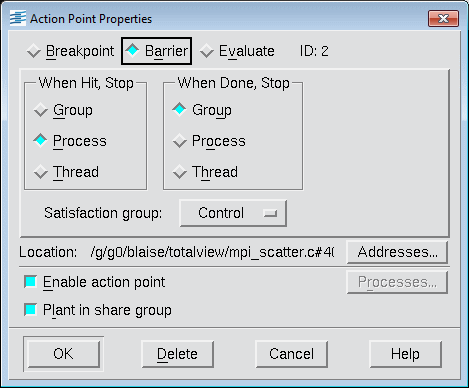
Barrier Point: holds each process when it reaches the barrier point until all processes in the group have reached the barrier point. Primarily for MPI programs.
Evaluation Point: causes a code fragment to execute when it is reached. Enables you to set "conditional breakpoints" and perform conditional execution.
Watchpoint: enables you to monitor a location in memory and either stop execution or evaluate an expression when the value stored in memory is modified.
Setting a Process Barrier Point
After selecting a source line, there are three ways to set a barrier point:
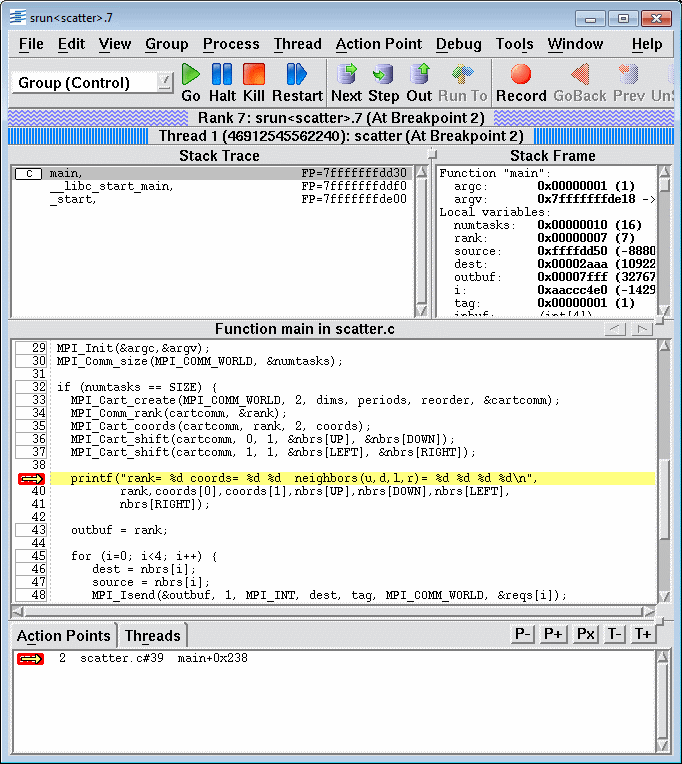
Method 1: (easiest) Right click on the source line and select Set Barrier from the resulting pop-up menu.
The source line will then display a blue BARR icon as shown below.
Blue BARR icon shown in the source line
As each process reaches the barrier point, TotalView will place that process in a "held" state.
After all processes have reached the barrier point, TotalView will automatically "release" them, however they remain stopped until you take further action.
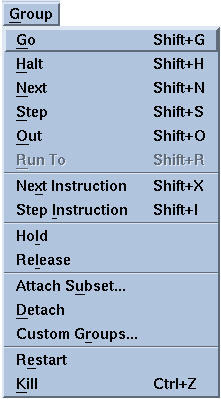
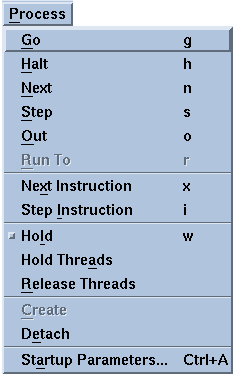
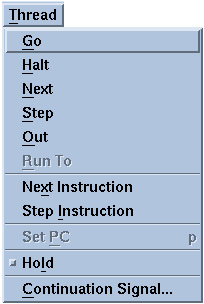
Note: As long a process is in a "held" state, it will ignore action commands as go, step, next, etc. You must first manually "release" it before attempting to resume execution. This can be done by selecting the Release command found in the Group, Process and Thread menus:
Group menu
Process menu
Thread menu
Setting an Evaluation Point
First, make sure that the program is stopped.
Open an Action Point Properties Dialog Box by either of these methods:
Method 2: Right click on the source line and select Properties from the resulting pop-up menu.
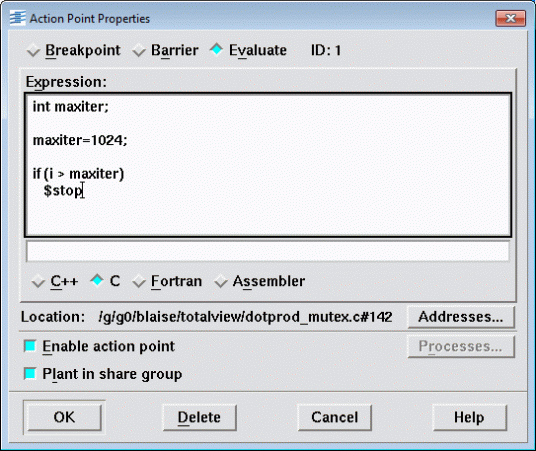
In the Action Point Properties Dialog Box, do the following:
Click on the Evaluate button
Select the button for the correct language if needed
Enter your code fragment in the expression box - an example is shown below. (Expressions were covered previously under Expression Evaluation).
Click on the OK button when finished.
Action point properties dialog box
The source line should now display an EVAL icon:
EVAL icon on source line
At runtime, the entered expression will be evaluated when it is encountered by a process or thread. Evaluation Point expressions are evaluated before the source code line.
Note Depending upon your platform, TotalView can either compile or interpret expressions, with the expected implications to performance. See the TotalView documentation for details.
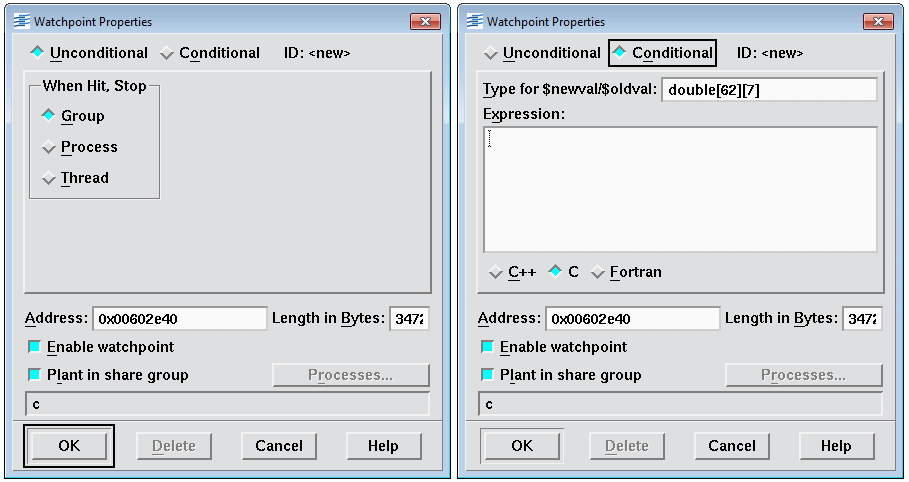
Setting a Watchpoint
You can monitor changes to specific memory locations by using a special kind of action point called a Data Watchpoint (or just Watchpoint for short).
Watchpoints are most often used to find a statement in your program that is writing to a "stray" or unintended memory location.
Watchpoints are triggered only when data in memory is modified. If a write occurs to a memory location but the value of the data is the same, the Watchpoint is not triggered.
There are two types of watchpoints:
Unconditional Watchpoint - program is automatically stopped by TotalView when the watchpoint is triggered.
Conditional Watchpoint - allows you to specify an expression that is evaluated when the watchpoint is triggered.
Note It is essential to consult the TotalView documentation before attempting to use watchpoints. There are numerous platform issues, restrictions and important details not mentioned here. For example, under Linux a watchpoint can't be larger than 4 bytes!
Note If watchpoints are not supported on your platform, this item will be "grayed out" and unable to be selected.
A Watchpoint Properties Dialog Box will appear. Unconditional will be selected by default. For Conditional watchpoints you will need to enter a valid expression. Click the OK button when finished. An example of both types of watchpoint dialog boxes appears below.
Watchpoint properties dialog box - unconditional and conditional
Conditional watchpoint expressions are identical to those used for Evaluation Points with some restrictions.
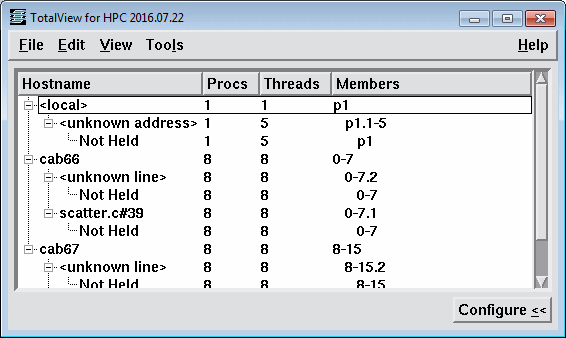
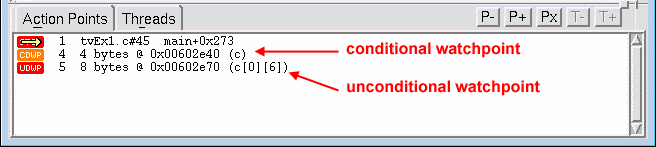
Unlike other action points, watchpoints do not display an icon on a source line, because they are associated with an address location, not a source line number. Their presence is shown in the Action Points Pane however:
Action points pane
Deleting Action Points
There are several ways to delete action points. Assuming that you have already selected a source line with an action point set:
Method 1: Right click on the source code line and then select Delete from the resulting pop-up menu.
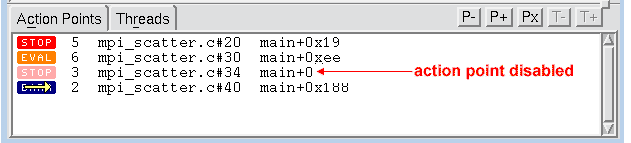
Disabling an action point means that it is made "inactive" without deleting it. Enabling a previously disabled action point means that it is made active again.
There are several ways to disable / enable an individual action point. Assuming that you have already selected source line with an action point set:
Method 1: Right click on the source code line and then select Disable or Enable from the resulting pop-up menu.
The filename for the action points file will be something similar to what's shown below (there is some variation in the actual naming format between different versions).
executable_name.TVD.v3breakpoints
You can also load previously saved action points into your current debugger session:
TotalView can be used to debug programs or processes that are already running. This can be particularly useful for diagnosing "hung" programs.
Typical scenario:
Start a program
Notice that the program is having problems
Start TotalView
Attach to the running process
Fix or diagnose the problem
Detach from process to resume execution - or else allow process to run to completion within TotalView
Exit TotalView
How to Attach to a Process
If possible, start totalview (no arguments) on the machine where your program is running. A Session Manager window should automatically appear with the usual Root Window.
In the Session Manager window, select the A running program (attach). An Attach to running program(s) dialog box will appear as shown below.
Dialog box to attach a running program
Select the process of interest (such as your hung program) from the process list, then click the Start Session button.
A new Process Window will appear, showing the state of the attached process and allowing you to debug it. In most cases, you will need to Halt the process before you can begin to debug it.
Note that you are also able to attach to processes on other machines through the Host: H+ button.
Detaching from a Process
When you are finished debugging an attached process, you can detach from it: PATHProcess Window > Process Menu > Detach
If you detach from a process that was not started by TotalView, it will remain in whatever state (i.e. running) it is in. TotalView will not automatically kill it.
If your program has a signal handler, you can also have TotalView send a signal to the process when it detaches: PATHProcess Window > Thread Menu > Continuation Signal
A Continuation Signal Dialog Box will appear. Select the signal TotalView should send to the process when it detaches, such as SIGSTOP
Setting Executable Command Arguments
How to Pass Arguments to Your Program
By default, TotalView does not pass arguments to a program being debugged.
If your program requires command line arguments, they must be passed to the program through TotalView before your program starts.
Method 1:
Use the -a flag on the UNIX shell command line when you start the debugger with the totalview command. This must be the last argument in the command string. For example:
When the Startup Parameters Dialog Box appears (below), make sure that the Arguments page is selected.
Enter the arguments to be passed to your program when it starts. Separate arguments with spaces or put each on a new line. For single arguments with embedded spaces, enclose the entire argument with double quotes.
Enter any environment variables if needed.
Select OK when finished.
Startup parameters dialog box
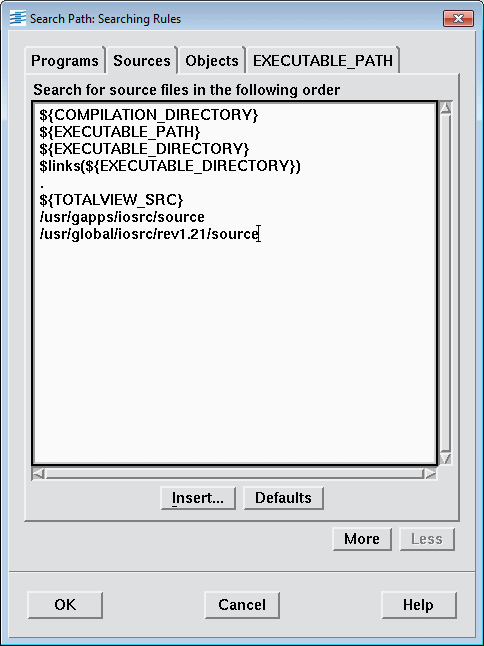
Setting Source Code Search Paths
Purpose
In cases where your source code and executables are not co-located, you may need to tell TotalView where to search for the various components.
Default Behavior
By default, the debugger will search the following directories (in order):
Current working directory
Path of an executable started with a full path name
Directories specified in your PATH environment variable.
In the Search Path Dialog Box (shown below), click on the Sources tab and then enter the directories that should be searched, in order. They can be separated with a space or a new line. Relative path names are permitted (relative to the current working directory).
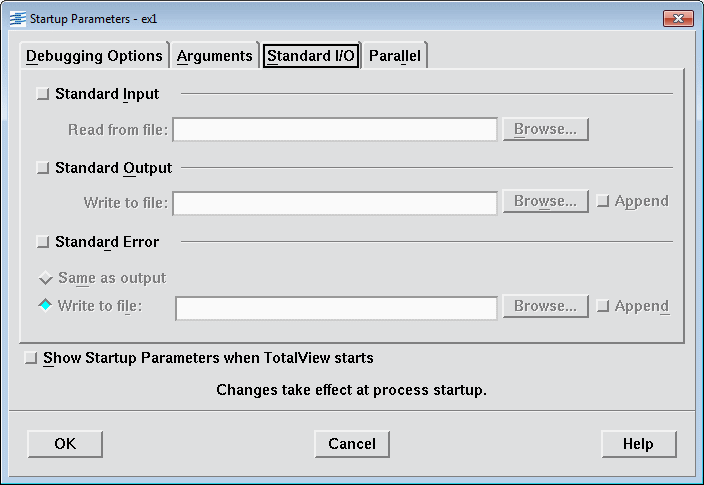
After the Startup Parameters Dialog Box appears be sure to select the Standard I/O Tab (below). Then enter file names and select from the available options as desired. Click OK when finished.
Startup parameters dialog box
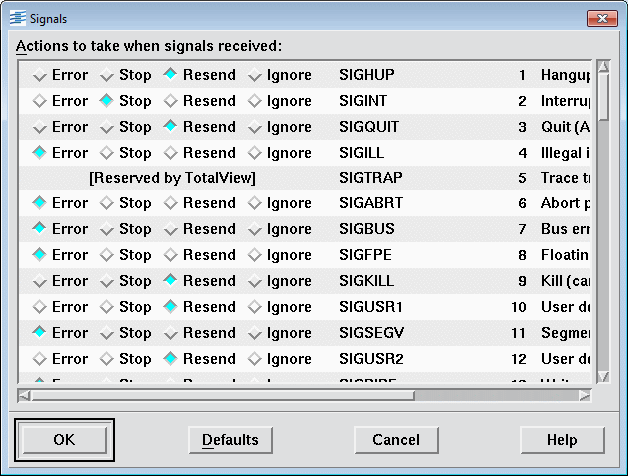
Signal Handling
Purpose
If your program includes its own signal handler routine, you may need to modify TotalView's defaults.
The Signal Handling Dialog Box will appear (below). Note that signal names, behaviors and numbers are platform specific.
Signal handling dialog box
Select the desired mode (behavior) for any given signal. Signal handling modes choices are:
Error - stops process, places it in an error state, and displays an error in the title bar of the process window.
Stop - stops process and places it in the stopped state. Equivalent to SIGSTOP.
Resend - debugger will send signal to the process. This mode should be used for all signals handled by your own signal handler routine.
Ignore - discards the signal and restarts the process without a signal. Should not be used for fatal signals, as it may cause the debugger to get caught in a signal/resignal loop.
Note TotalView uses the SIGTRAP and SIGSTOP signals internally. If either occurs, TotalView neither stops the process with an error or has the signal sent back to the program. This behavior cannot be changed.
See the TotalView documentation for details.
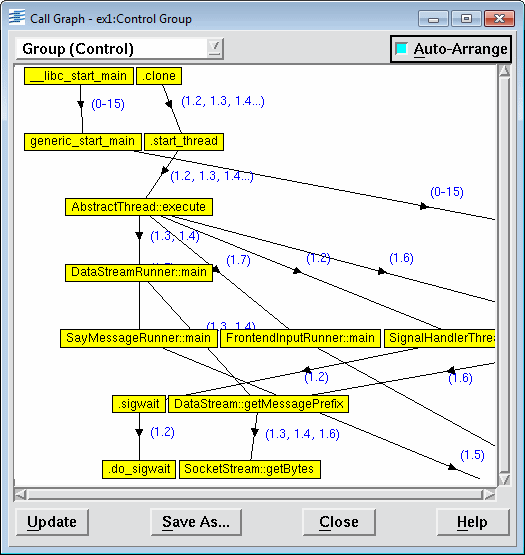
Displaying Your Program's Call Graph
TotalView's Call Graph Diagram can be used to show all of your program's active routines. These routines are linked by arrows indicating that one routine is called by another.
The Call Graph Diagram is dynamic - the display reflects the current program state.
The ability to selectively display the call tree by process/thread group is provided by the drop-down menu at the top of the graph.
The Update button tells TotalView to recreate this display for a new process/thread group, or to see how the call tree has changed as a result of running the program to another point.
The Save As button allows you to save your graph in Graphiz.dot format.
An example Call Graph Diagram is shown below.
Example of call graph diagram
Debugging Memory Problems
MemoryScape
TotalView includes full featured memory debugging functionality. This is packaged as a separate, but integrated, client called MemoryScape.
Key features include:
Memory usage reports
Leak detection
Heap status
Corrupted memory detection
Dangling pointer detection and pointer status
Event and error notification
Setting guard blocks
Block painting
Covering the many features included in MemoryScape would require a separate tutorial. Only a few very basics are covered here.
The MemoryScape executable, called memscape is located in the same directory as the totalview executable.
Invoking MemoryScape directly - examples:
Command
Description
memscape
Brings up the main MemoryScape window
memscape myprog
Opens MemoryScape with your program
memscape myprog -a arguments
Opens MemoryScape with your program and your program's arguments
memscape myprog memscape_options
Opens MemoryScape with your program under the specified MemoryScape options
memscape srun -a -n8
-ppdebug myprog
LC parallel job on a linux cluster: opens MemoryScape with srun, used to launch your parallel MPI program; uses 8 tasks in the pdebug pool.
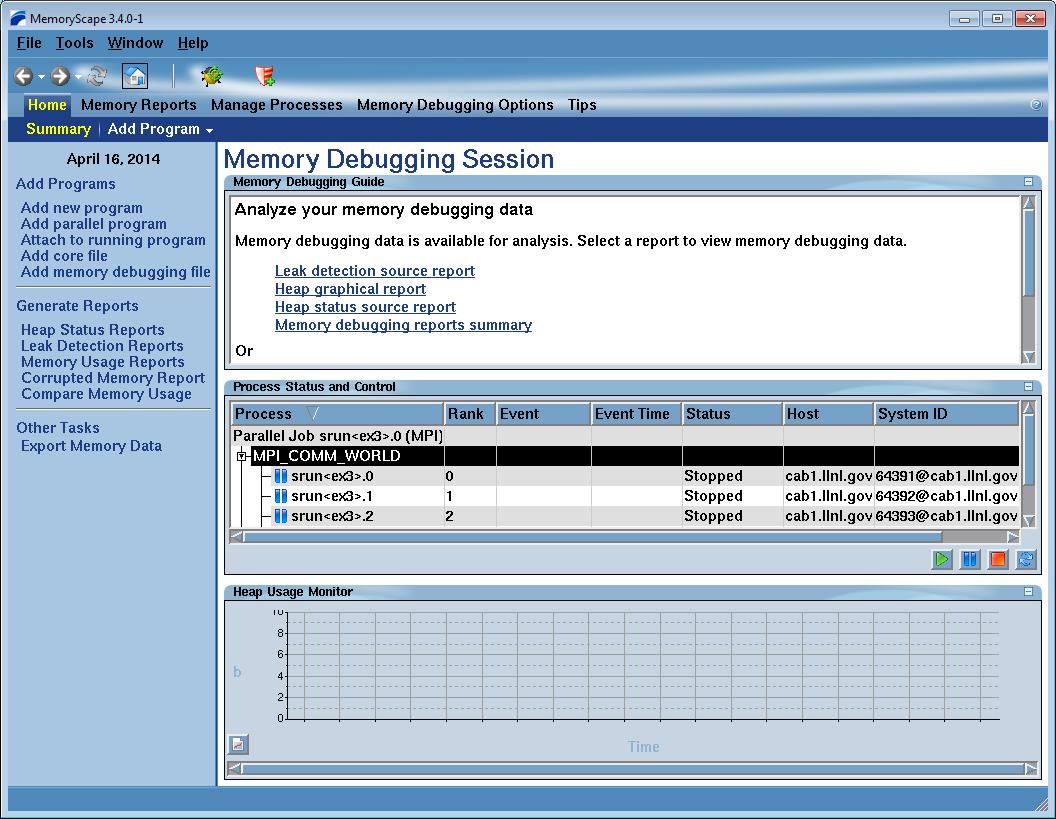
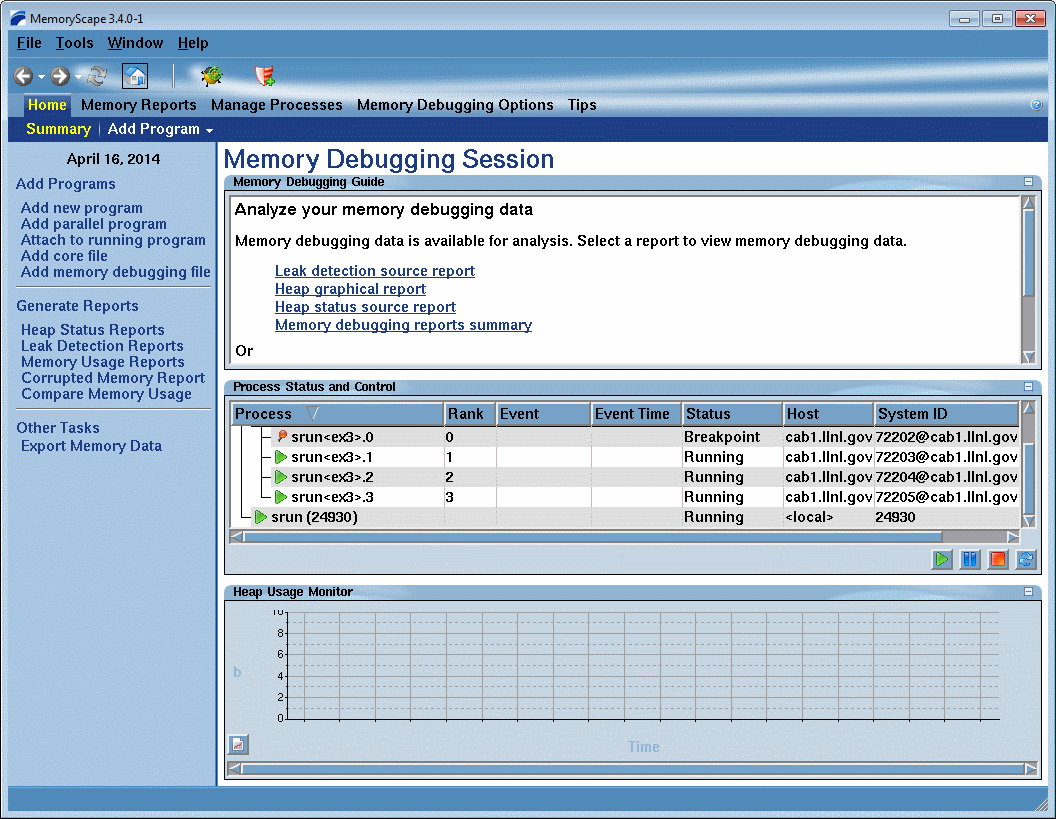
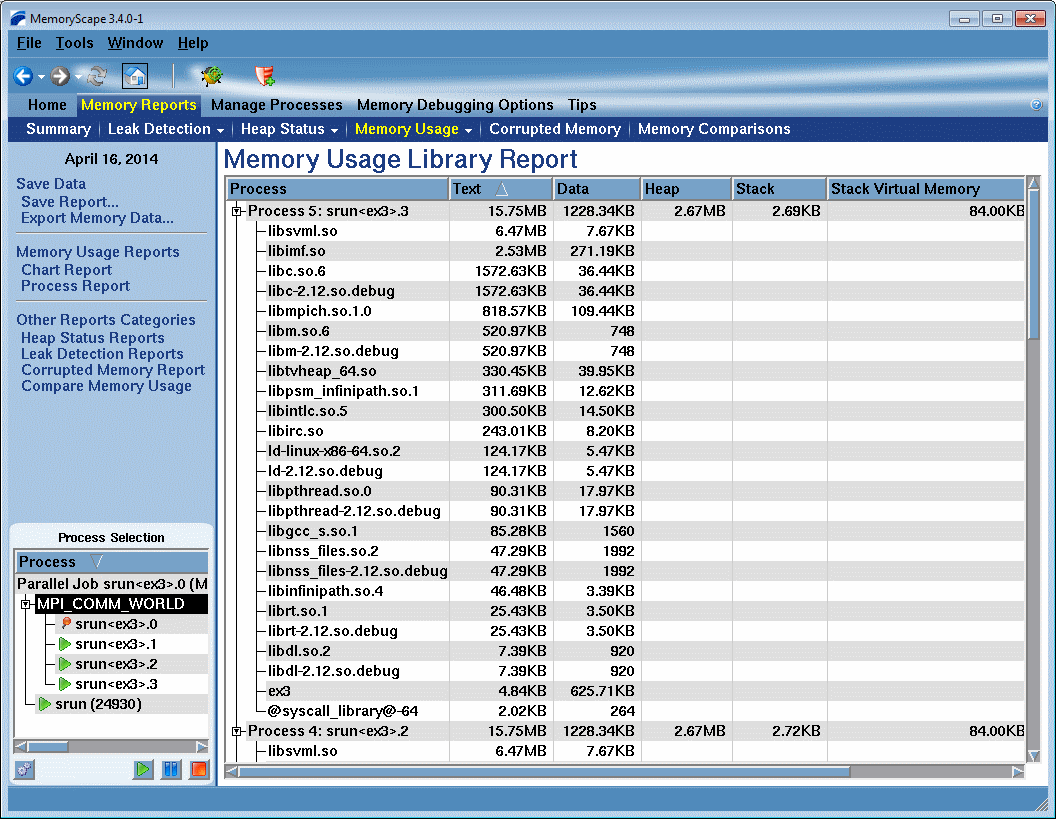
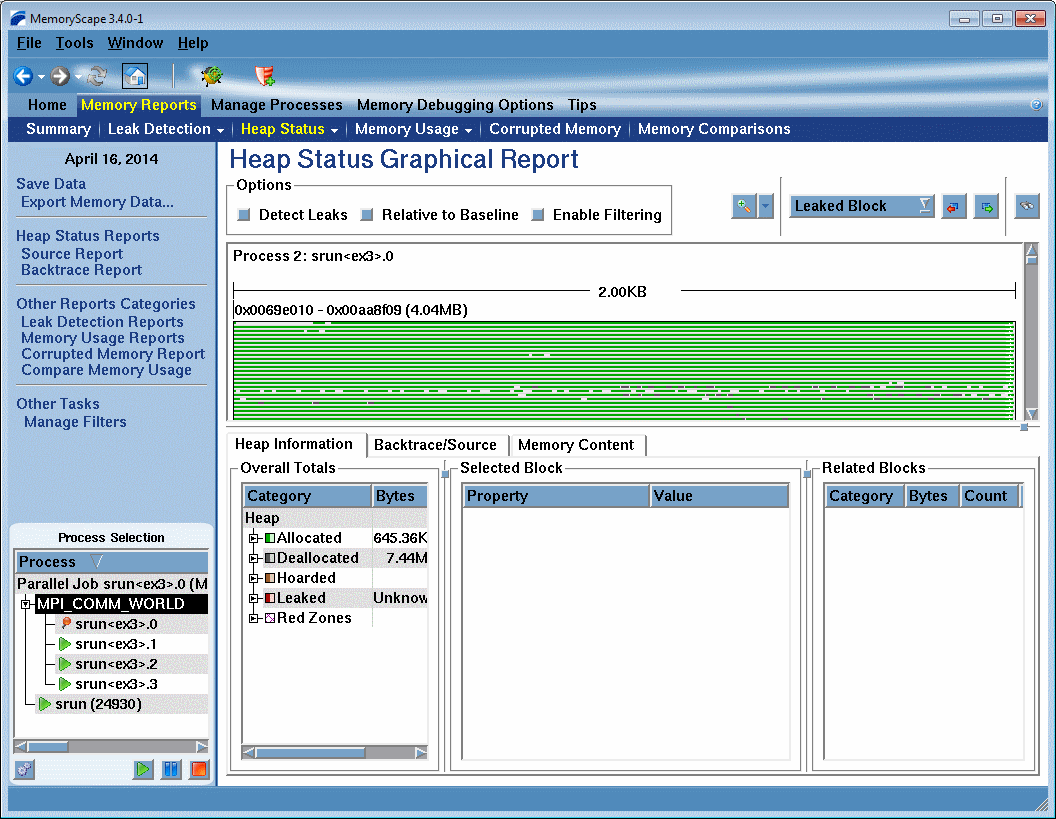
Once MemoryScape starts up, you will be presented with the main opening window, which allows you to set options, execution, memory debugging, generation of memory reports and more. Click on the small image below for a larger image.
MemoryScape
Starting MemoryScape from within a TotalView session:
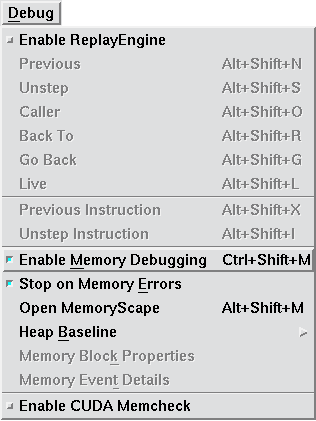
Before your program starts to run, turn on memory debugging (it's usually set to off by default): PATHProcess Window > Debug Menu > Enable Memory Debugging
Run your program under TotalView as usual, to a stopping point. Then launch MemoryScape: PATHProcess Window > Debug Menu > Open MemoryScape
The MemoryScape main window should then appear as shown above.
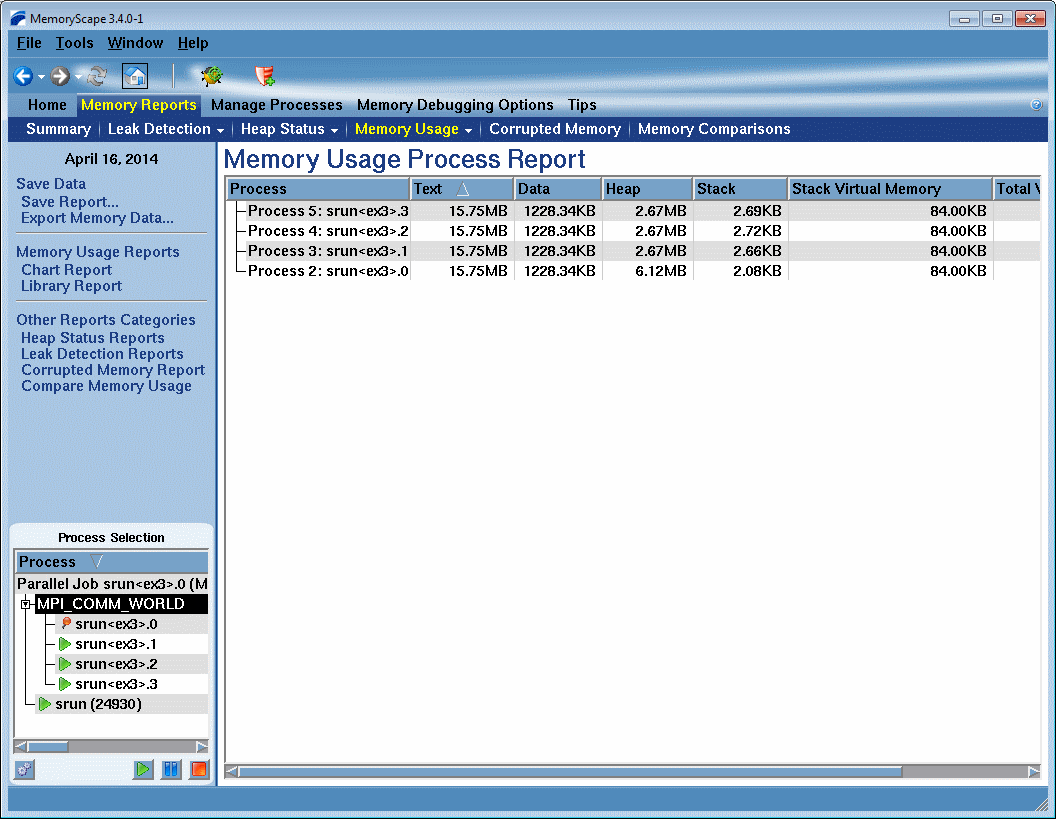
Some Example MemoryScape Displays
Click on the small images for a larger image.
Setting Preferences
About Preferences
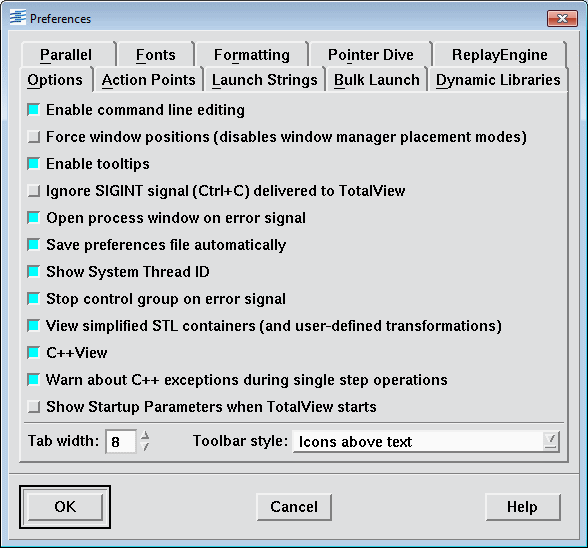
Users can control many aspects of TotalView's appearance and behavior through setting Preferences.
The Preferences Dialog Box is used to view and set preferences. It can be opened by using either of the paths below:
The Preferences Dialog Box (below) is comprised of multiple pages that serve to group preferences into general categories.
Preferences dialog box
Options: This page contains several options that are general or miscellaneous in nature (shown above).
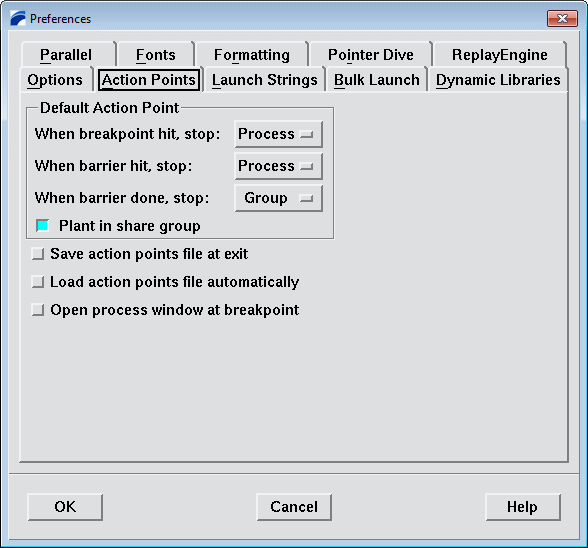
Action Points: The commands on this page indicate what else is stopped, if anything, when TotalView encounters an action point, the scope of the action point, automatic saving and loading, and if TotalView should open a Process Window for the process encountering a breakpoint.
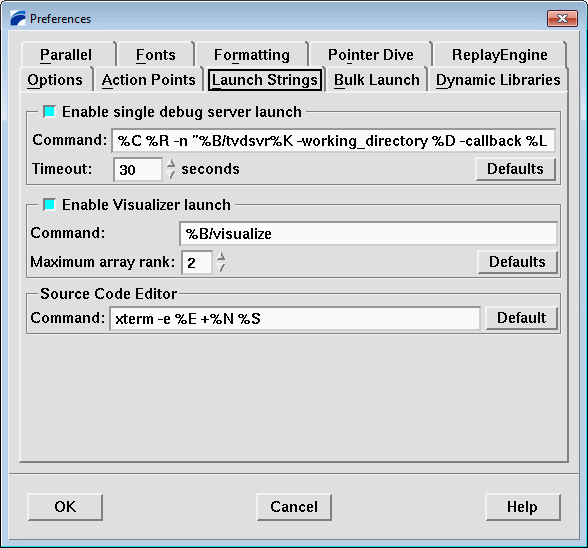
Launch Strings: The three areas of this page let you set the launch string when TotalView launches its remote debugging server, the Visualizer, and a source code editor. Notice that there are default values for these that are platform specific.
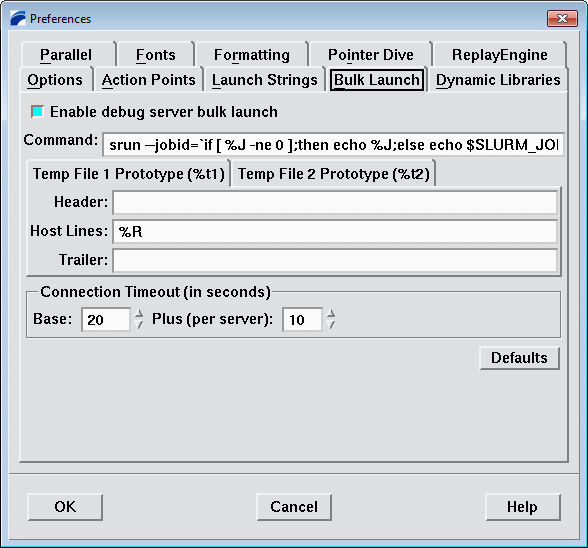
Bulk Launch: This page allows you to change the bulk launch command, disable bulk launch, and alter connection timeouts used by TotalView when it launches the tvdsvr programs.
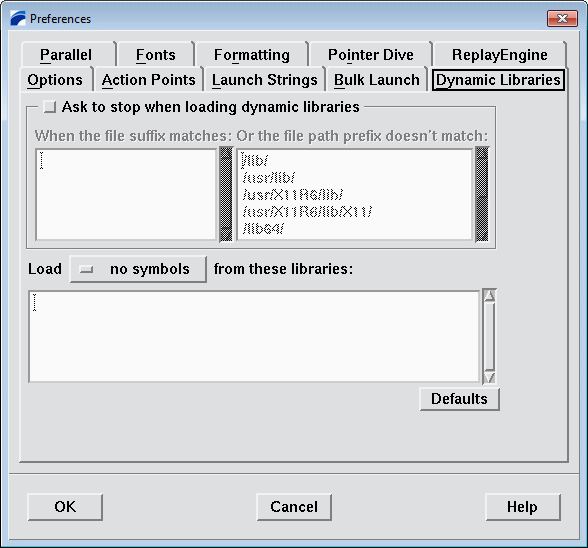
Dynamic Libraries: This page lets you control which symbols are added to TotalView when it loads a dynamic library.
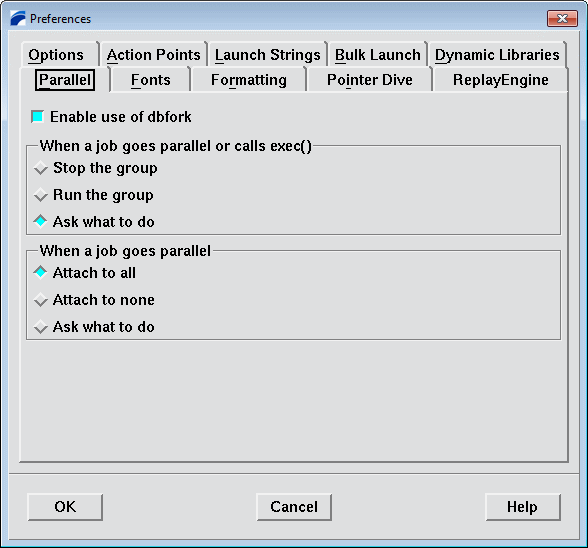
Parallel: This page lets you define what will occur when your program goes parallel.
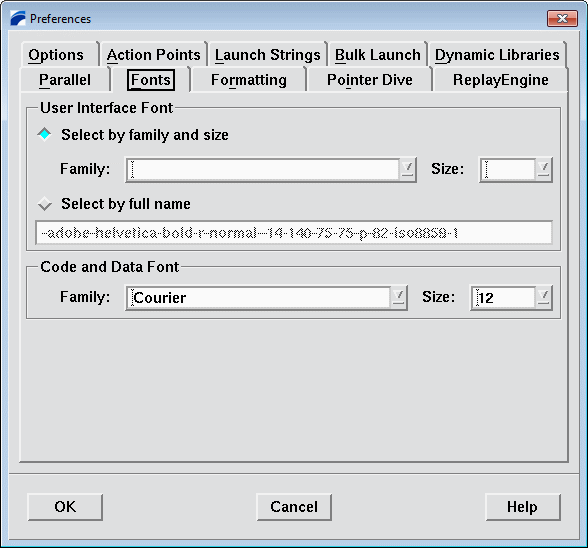
Fonts: Use this page to specify the fonts used in the user interface and when TotalView displays your code and program data.
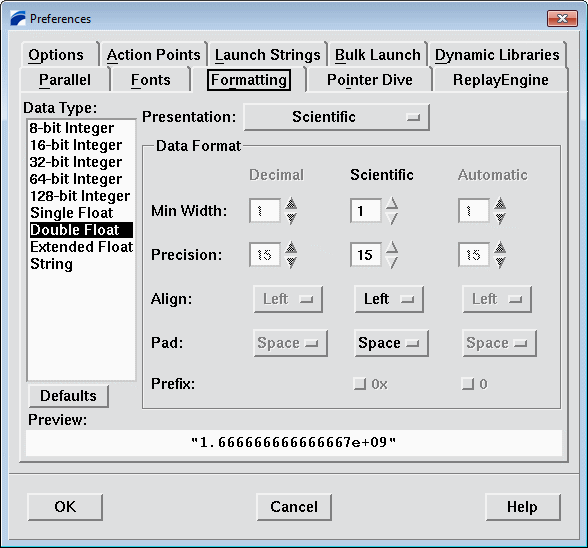
Formatting: Allows you to specify how variables of different data types are displayed.
Pointer Dive: Specifies when pointers are dereferenced in TotalView displays.
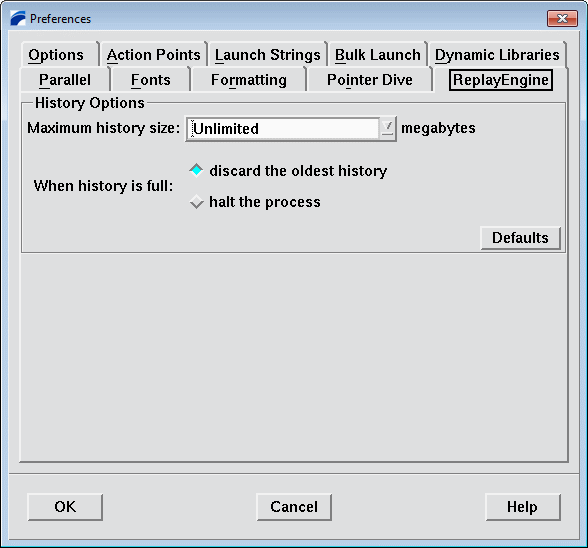
Replay Engine: Specifies a couple options for TotalView's Replay Engine feature.
Visualizing Array Data
The TotalView Visualizer
The TotalView Visualizer works with the debugger software to create graphical displays of your program's data. It is a self-contained process that can be launched from the debugger, or alone on the command line.
The debugger is used to capture the data you select. The Visualizer is used to view the captured data.
Data can be visualized while the debugger is running, or separately by reading the captured data from a file without the debugger.
Types of data that can be visualized:
One and two-dimensional arrays of integer or floating-point data.
Arrays with greater than two dimensions can be visualized by using TotalView's array "slicing" feature to create arrays with one or two dimensions.
Using the TotalView intrinsic $visualize, you can also visualize array variables from within an Evaluate Window or Evaluation Point. Some examples are shown below.
Visualizer Animation: using $visualize within an evaluation point causes TotalView to update the array display every time TotalView reaches the evaluation point. This technique has the effect of producing an animation of the changing array data.
For other Visualizer options and information, consult the TotalView documentation.
Getting Started
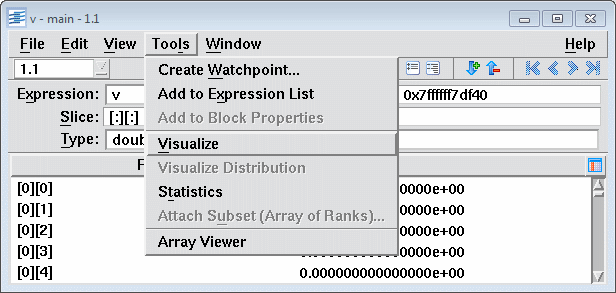
Variable window's tools menu
Run your program in TotalView to a breakpoint where you know the array of interest will have relevant data.
Dive on the array variable. A Variable Window will then open, showing the contents of the array.
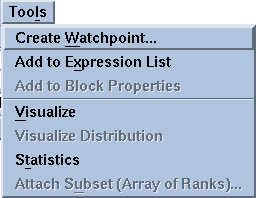
Select Visualize from the Variable Window's Tools Menu. Shown at right.
The Dataset Window will then appear, as will a Graph View Window or Surface View Window of your array data (depending upon which view the visualizer thinks is best). Examples of all three windows are shown below.
Primary Visualizer Windows
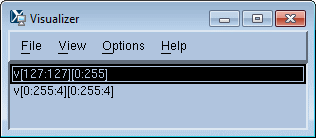
Dataset Window
Shows the data sets that are available for visualization.
View menu selects between graph and surface views.
Dataset window
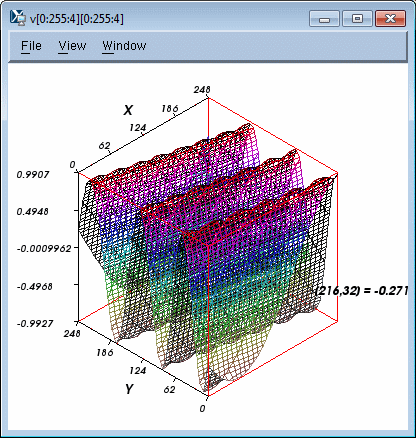
Surface View Window
Left mouse click and then typing "p" or "P" on a plot area will display data value at that point.
Dragging with left mouse button controls rotation of display.
Surface view window
Graph View Window
Same data set as in the above surface view.
Left mouse click and then typing "p" or "P" on a plot area will display data value at that point.
File menu Options selection allows plotting as lines, points or both.
Graph view window
Command Line Interpreter (CLI)
The TotalView Command Line Interpreter (CLI) provides a command line debugger interface. It can be launched either stand-alone or via the TotalView GUI debugger.
The CLI consists of two primary components:
The CLI commands
A Tcl interpreter
Because the CLI includes a Tcl interpreter, CLI commands can be integrated into user-written Tcl programs/scripts for "automated" debugging. Of course, putting the CLI to real use in this manner will require some expertise in Tcl.
Most often, the TotalView GUI is the method of choice for debugging. However, the CLI may be the method of choice in those circumstances where using the GUI is impractical:
When a program takes several days to execute.
When the program must be run under a batch scheduling system or network conditions that inhibit GUI interaction.
When network traffic between the executing program and the person debugging is not permitted or limits the use of the GUI.
A TotalView CLI xterm window (below) will then open for you to enter CLI commands.
Load/Start your executable or attach to a running process
Issue CLI commands
CLI xterm window
Method 2: From a shell prompt window:
Invoke the totalviewcli command (provided that it is in your path).
Load/Start your executable or attach to a running process
Issue CLI commands
CLI Commands
As of TotalView version 8, there are approximately 60 CLI commands. These are covered completely in the TotalView Reference Guide.
Some representative CLI commands are shown in the table below.
Environment Commands
alias
Creates or views user-defined commands.
capture
Allows commands that print information to instead send their output to a string variable
dgroups
Manipulates and manages groups
dset
Changes or views values of CLI state variables
dunset
Restores default settings of CLI state variables
help
Displays help information
stty
Sets terminal properties
unalias
Removes a previously defined command
dworker
Adds or removes a thread from a workers group
CLI Initialization and Termination
dattach
Attaches to one or more processes currently executing in the normal run-time environment
ddetach
Detaches from processes
dkill
Kills existing user process, leaving debugging information in place
dload
Loads debugging information about the target program into TotalView and prepares it for execution
dreload
Reloads the current executable
drerun
Restarts a process
drun
Starts or restarts the execution of users processes under control of the CLI
dstatus
Shows current status of processes and threads
quit
Exits from the CLI, ending the debugging session
Program Information
dassign
Changes the value of a scalar variable
dlist
Browses source code relative to a particular file, procedure or line
dmstat
Displays memory use information
dprint
Evaluates an expression or program variable and displays the resulting value
dptsets
Shows status of processes and threads
dwhat
Determines what a name refers to
dwhere
Prints information about the target thread's stack
Execution Control
dcont
Continues execution of processes and waits for them
dfocus
Changes the set of process, threads, or groups upon which a CLI command acts
dgo
Resumes execution of processes (without blocking)
dhalt
Suspends execution of processes
dhold
Holds threads or processes
dnext
Executes statements, moving into subfunctions if required
dnexti
Executes machine instructions, stebbing over subfunctions
dout
Runs out from the current subroutine
dstep
Executes statements, moving into subfunctions if required
dstepi
Executes machine instructions, moving into subfunctions if required
dunhold
Releases a held process or thread
duntil
Runs the process until a target place is reached
dwait
Blocks command input until processes stop
Action Points
dactions
Views information on action point definitions and their current status
dbarrier
Defines a process or thread barrier breakpoint
dbreak
Defines a breakpoint
ddelete
Deletes an action point
ddisable
Temporarily disables an action point
denable
Reenables an action point that has been disabled
dwatch
Defines a watchpoint
Miscellaneous
dcache
Clears the remote library cache
ddown
Moves down the call stack
dflush
Unwinds stack from suspended computations
dlappend
Appends list elements to a TotalView variable
dup
Moves up the call stack
Example Interactive TotalView CLI Debug Session
This simple example demonstrates the interactive use of the TotalView CLI. The example program does nothing more than go into an infinite loop. The CLI commands are then used to "debug" it.
CLI commands are in green text. Annotations/comments are in red text.
First, make sure the CLI is in our path
% which totalviewcli
/usr/local/bin/totalviewcli
List the program. Note the bug.
% cat spinhung.c
/******************************************************************************
* FILE: spinhung.c
* DESCRIPTION:
* Simple example file
* Compile: gcc -g spinhung.c -o spinhung
*
****************************************************************************/
main() {
int i, j, x;
i=99;
while (i < 100) {
x = 2*i;
j = i;
}
}
Start the CLI
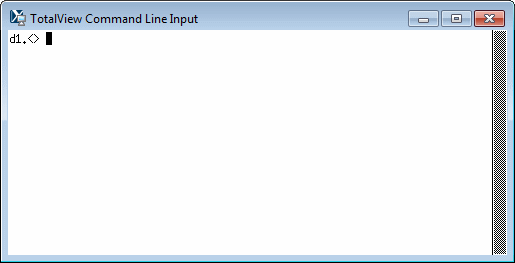
% totalviewcli
d1.<>
Load the program
d1.<> dload spinhung
1
d1.<>
List the program
d1.<> dlist 1 -n 20
1 /******************************************************************************
2 * FILE: spinhung.c
3 * DESCRIPTION:
4 * Simple example file
5 * Compile: gcc -g spinhung.c -o spinhung
6 *
7 ****************************************************************************/
8
9 main() {
10
11 int i, j, x;
12
13 i=99;
14 while (i < 100) {
15 x = 2*i;
16 j = i;
17 }
18
19 }
Display CLI settings
d1.<> dset
BARRIER_STOP_ALL process
BARRIER_STOP_WHEN_DONE group
CGROUP(1) 1
COMMAND_EDITING false
EXECUTABLE_PATH {}
EXECUTABLE_SEARCH_MAPPINGS {}
EXECUTABLE_SEARCH_PATH {${EXECUTABLE_PATH}:${PATH}:.}
GROUP(1) {control 1}
GROUP(2) workers
GROUP(3) {share 1}
GROUPS {1 2 3}
LINES_PER_SCREEN AUTO
MAX_LEVELS 512
MAX_LIST 20
OBJECT_SEARCH_MAPPINGS {}
OBJECT_SEARCH_PATH {${COMPILATION_DIRECTORY}:${EXECUTABLE_PATH}:${EXECUTABLE_DIRECTORY}:$links(${EXECUTABLE_DIRECTORY}):.:${TOTALVIEW_SRC}}
PROMPT {[dfocus]> }
PTSET d1.<
SGROUP(1) 3
SHARED_LIBRARY_SEARCH_MAPPINGS {}
SHARED_LIBRARY_SEARCH_PATH {${EXECUTABLE_DIRECTORY}}
SHARE_ACTION_POINT true
SOURCE_SEARCH_MAPPINGS {}
SOURCE_SEARCH_PATH {${COMPILATION_DIRECTORY}:${EXECUTABLE_PATH}:${EXECUTABLE_DIRECTORY}:$links(${EXECUTABLE_DIRECTORY}):.:${TOTALVIEW_SRC}}
STOP_ALL process
TAB_WIDTH 8
TOTALVIEW_ROOT_PATH /collab/usr/global/tools/totalview/r/toolworks/totalview.8.12.0-1/linux-x86-64
TOTALVIEW_TCLLIB_PATH /collab/usr/global/tools/totalview/r/toolworks/totalview.8.12.0-1/lib
TOTALVIEW_VERSION {Linux x86_64 TotalView 8.12.0-1}
VERBOSE error
WGROUP(1) 2
Set a breakpoint at line 15
d1.<> dbreak 15
1
Start the program
d1.<> drunDisplay process status
d1.<>dstatus
1 (18902) Breakpoint [spinhung]
1.1 (18902/18902) Breakpoint PC=0x0040052b, [/g/g0/blaise/totalview/spinhung.c#15]
List the program again - note the breakpoint on line 15
d1.<> dlist 1 -n 20
1 /******************************************************************************
2 * FILE: spinhung.c
3 * DESCRIPTION:
4 * Simple example file
5 * Compile: cc -g spinhung.c -o spinhung
6 *
7 ****************************************************************************/
8
9 main() {
10
11 int i, j, x;
12
13 i=99;
14 while (i < 100) {
15@> x = 2*i;
16 j = i;
17 }
18
19 }
Display a variable value
d1.<> dprint i
i = 0x00000063 (99)
Query about action points
d1.<> dactions
1 shared action point for group 3:
1 [spinhung.c#15] Enabled
Step through program
d1.<> dstep
16 > j = i;
d1.<> dstep
14 > while (i < 100) {
Delete the breakpoint and then relist the program - note that
breakpoint is gone.
d1.<> ddelete 1
d1.<> dlist 1 -n 20
1 /******************************************************************************
2 * FILE: spinhung.c
3 * DESCRIPTION:
4 * Simple example file
5 * Compile: cc -g spinhung.c -o spinhung
6 *
7 ****************************************************************************/
8
9 main() {
10
11 int i, j, x;
12
13 i=99;
14 > while (i < 100) {
15 x = 2*i;
16 j = i;
17 }
18
19 }
Resume execution and note where program is hung
d1.<> dgo
d1.<> dwhere
> 0 main PC=0x00400523, FP=0x7fffffffdf20 [/g/g0/blaise/totalview/spinhung.c#14]
1 __libc_start_main PC=0x2aaaab186cd9, FP=0x7fffffffdfe0 [/lib64/libc.so.6]
2 _start PC=0x00400454, FP=0x7fffffffdff0 [/g/g0/blaise/totalview/spinhung]
Halt the program and "fix" the bug
d1.<> dhalt
d1.<> dassign i 101Resume execution and prove that the program exits to completion
d1.<> dgo
d1.<> dwhere
dwhere: Focus thread was not found in process 1
Quit the CLI and return to the shell
d1.<> quit
Do you really wish to exit TotalView? y
This concludes TotalView Part 2. Where would you like to go now?


