
Part 3 Contents
- Process/Thread Groups
- Debugging Threaded Codes
- Debugging OpenMP Codes
- Debugging MPI Codes
- Debugging Hybrid Codes
- Batch System Debugging
- Topics Not Covered
- References and More Information
- Back to Part 1: The Very Basics
- Back to Part 2: Common Functions
Preface
- TotalView supports most HPC parallel programming models/APIs:
- MPI
- Pthreads
- OpenMP
- Intel Xeon Phi
- NVIDIA CUDA, OpenACC
- PVM
- SHMEM
- Fork/exec
- Hybrid
- This tutorial will only cover the parallel models of Pthreads, MPI, OpenMP, and hybrids of these three models.
- Most examples, commands and images shown are for an LC Linux platform. However, TotalView's appearance and behavior are fairly consistent across all platforms.
- Please consult the TotalView Documentation located at Rogue Wave Software, Inc. for platform specific details.
Process/Thread Groups
TotalView P/T Groups
- Process/Thread (P/T) groups are a TotalView fabrication. Their purpose is to organize processes and threads into associations that a user can operate on.
- Dynamic membership: TotalView automatically creates these P/T groups and places processes and threads in them as they are created.
- Motivation: TotalView commands typically act upon a specific P/T group. It is important for parallel program users to know which P/T group is being acted upon!
- User-defined P/T Groups:
- In most cases, the default TotalView P/T groups are sufficient - however...
- TotalView provides a way for users to create their own P/T groups.
- Non-trivial and not covered here.
- TotalView's P/T groups are described very well in the "TotalView User Guide."
Types of P/T Groups
- Control Group:
- Contains all processes and threads created by the program across all processors
- Share Group:
- Contains all of the processes and their threads, that are running the same executable
- A program may have multiple Share Groups. For example all processes executing a.out would be in one Share Group, and all processes executing b.out would be in another Share Group
- Workers Group:
- Contains all threads that are executing user code
- May span multiple process Share Groups
- Does not contain kernel-level manager threads
- Lockstep Group:
- Includes all threads in a Share Group that are at the same PC (program counter) address
- A subset of the Workers Group
- Only valid for stopped threads - meaningless otherwise
Selecting P/T Groups
- When you select a P/T group, you are telling TotalView which set of processes and threads to act upon.
- You can select any of the available predefined P/T groups. The default is Control Group.
- Always relative to the Thread-of-Interest (TOI) and the Process-of-Interest (POI), which are the thread and process being viewed in the current Process Window.
- P/T groups can be selected from the Process Window's P/T Selection menu as shown below.
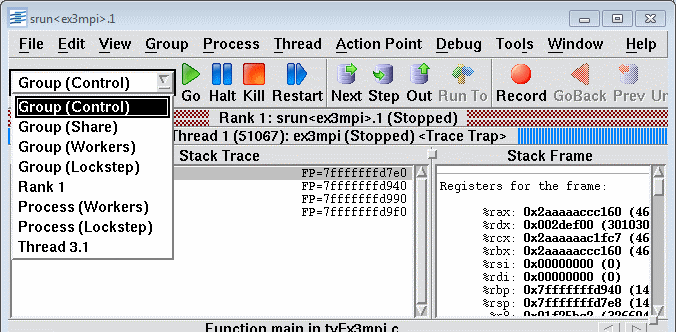
- The table below describes what happens when a particular P/T group is selected.
| P/T Selection | What is affected by any execution command |
|---|---|
| Group (Control) | Default. All processes and their threads. |
| Group (Share) | All processes and their threads that are in the same share group as the POI (process-of-interest) |
| Group (Workers) | All threads that are executing user code |
| Group (Lockstep) | All user threads that are stopped at the same PC |
| Rank 1 | Only the POI and its threads. In the above example, the POI happens to have an MPI rank of 1 |
| Process (Workers) | User threads in the POI |
| Process (Lockstep) | User threads stopped at the same PC in the POI |
| Thread 3.1 | Only the TOI (thread-of-interest). In the above example, the TOI happens to be 3.1 |
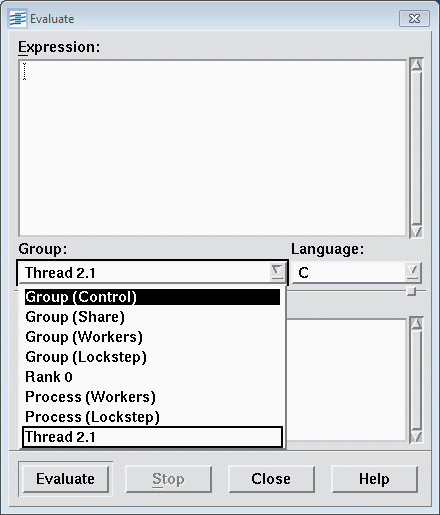
- P/T groups can also be selected from other locations, such as the Evaluate Dialog Box:
Important
- For most users (especially new users), just accepting the TotalView default Control P/T group does the trick.
- There is quite a bit more to TotalView's P/T groups than what is described above. See the TotalView documentation for details.
Debugging Threaded Codes
Overview
General Threads Model
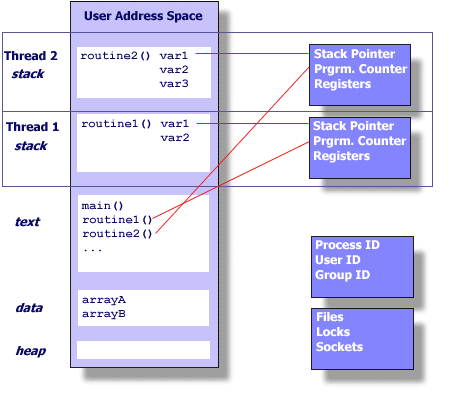
- Most operating systems support programs that have multiple threads of execution. Although implementations differ, they usually possess the following common characteristics:
- Shared address space - threads can read/write the same variables and execute the same code.
- Private execution context - every thread has its own set of registers
- Private execution stack - every thread has address space reserved for its stack
- Thread - process association - threads exist within and use the resources of a process. They cannot exist outside of a process.
- The diagram below depicts the general threads model. TotalView follows this general model.
Supported Platforms
- TotalView supports debugging threaded applications on all of its supported platforms.
Important Differences
- Threads are implemented differently by different operating systems. Also, different versions of the same operating system may differ in the way threads are handled.
- Because of this, some thread behavior within TotalView is both architecture and software version dependent:
- Not all features are implemented, or implemented identically on all platforms
- Patches and/or upgrades to the OS and other software may be required
- Hardware requirements vary between platforms (minimum disk, memory, etc.)
- Restrictions and known problems vary between platforms
- Please consult the TotalView documentation for important details.
Finding Thread Information
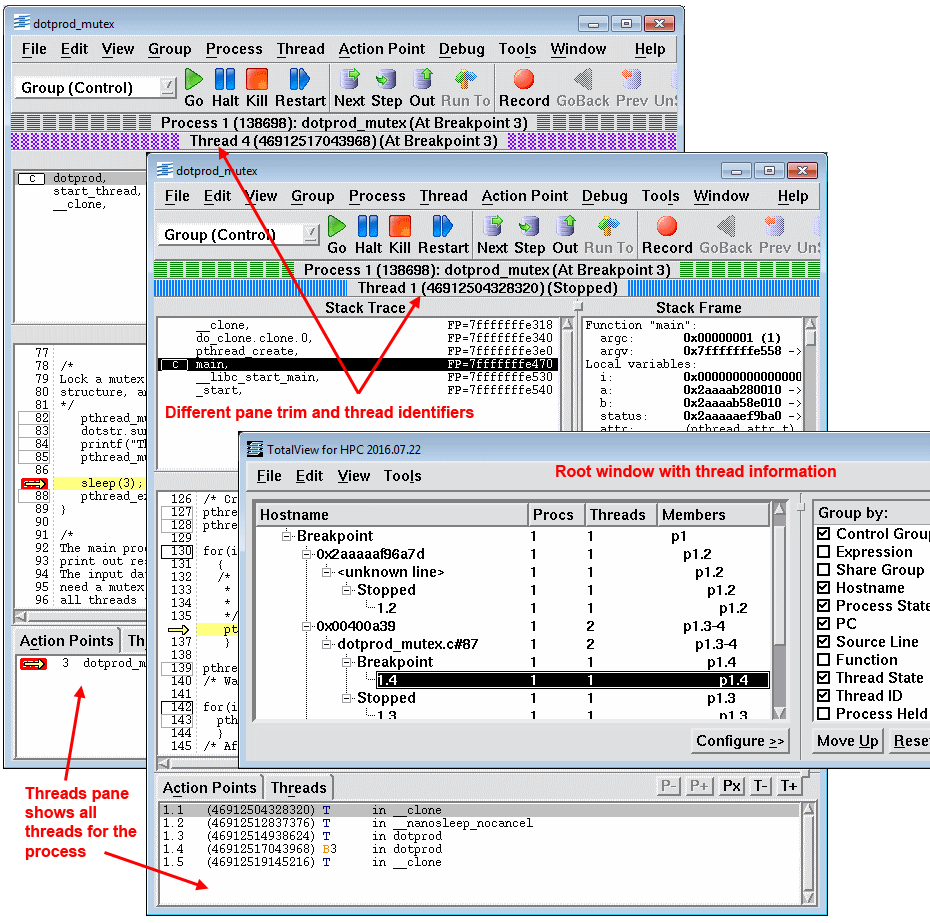
Root Window
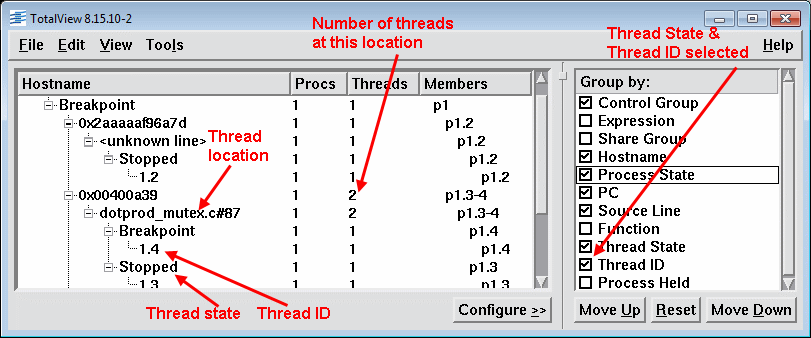
- Thread information is visible in the Root Window, as shown below
- The amount of thread related information displayed can be selected by clicking on the "Configure" button, which opens a checkbox menu.
Process Window
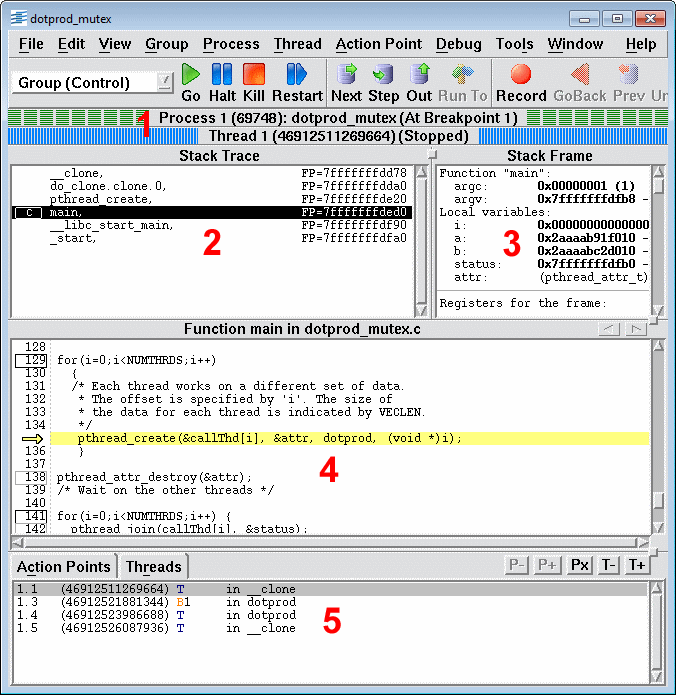
- Most of what TotalView knows about a thread is able to be found in the Process Window's panes.
- Status Bars: Show status information for the selected thread and its associated process.
- Stack Trace Pane: Displays the call stack of routines that the selected thread is executing.
- Stack Frame Pane: Shows a selected thread's stack variables, registers, etc.
- Source Pane: Shows the source code for the selected thread.
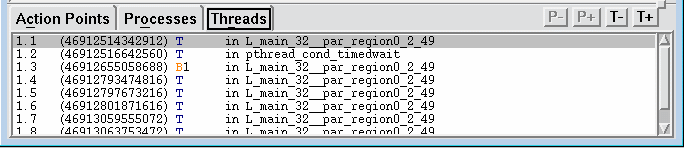
- Threads Pane: Shows threads associated with the selected process.
Selecting a Thread
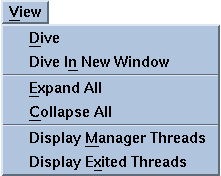
By Diving
- After selecting a thread in either the Root Window or the Process Window Threads Pane, you can dive on it by three different methods:
- Double left clicking
- Right clicking and then selecting Dive from the pop-up menu
- Selecting Dive from the Root Window's View Menu.
- That thread's information will then be displayed in the current Process Window.
- To force a new Process Window for a thread, use Dive in New Window from the View Menu or pop-up menu. Multiple Process Windows, one for each thread, can be created this way.
By Thread Navigation Buttons
- Use the thread navigation control buttons (below) located in the bottom right corner of the Process Window.
- "Cycle-through" the threads until the desired thread's information fills the Process Window.
Differentiating Threads
- Debugging multi-threaded programs can be confusing - especially if you've opened multiple Process Windows for the different threads. TotalView provides two easy ways for you to differentiate threads from each other:
- Every thread has a unique "Thread ID" number assigned by TotalView. The TID appears in several locations, such as the Root Window, Process Window Threads Pane and Process Window Status Bar.
- Different threads are given different pane "trim," as shown below.
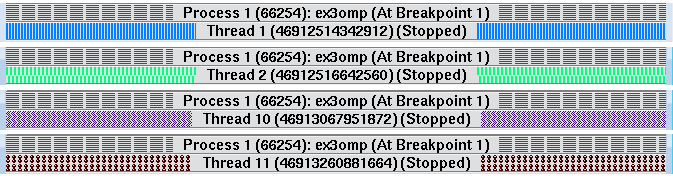
- The examples below demonstrate how threads are differentiated from each other as just described.
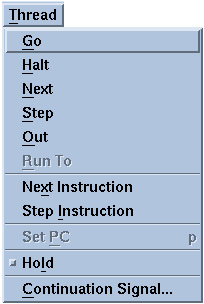
Execution Control for Threaded Programs
Three Scopes of Influence
- Depending upon the type of parallel application, TotalView can provide up to three different levels of control for thread execution commands. The table below describes these.
| Scope | Description |
|---|---|
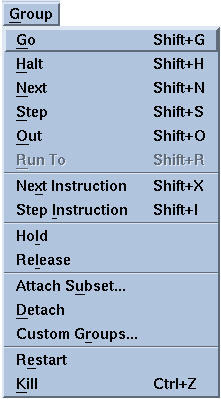
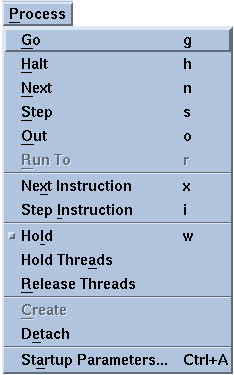
| Group | Typically used for multi-process, multi-threaded codes Execution commands apply to all threads in all processes PATH: Process Window > Group Menu |
| Process | Typically used for a multi-threaded process Applies to all threads in a single process PATH: Process Window > Process Menu |
| Thread | Applies to a single thread within a single process PATH: Process Window > Thread Menu Note that the thread specific execution control commands are not available on all platforms. They will appear to be dimmed in the menu if they are not available on the platform you are using. |
- Note that command scope is constrained to the selected TotalView P/T group (Control, Share, Workers, Lockstep) as discussed in the Process/Thread Groups section.
Synchronous vs. Asynchronous
- Synchronous: if one thread in a process runs/stops, all threads must do likewise.
- Asynchronous: threads within a process can run/stop independently of each other.
- Platforms may differ in the way individual threads can be stopped and made to run.
- For asynchronous thread control, unexpected program behavior (like hanging) can occur if some threads step or run while others are stopped - particularly in library routines. CTRL-C may be able to be used to cancel the command that caused the hang.
Thread-specific Breakpoints
- Normally, all threads in a process stop when any one of them encounters a breakpoint.
- Thread-specific breakpoints are implemented through evaluation points and the use of TotalView expressions that include intrinsic variables and built-in statements.
- For example, the following expression will cause the process to stop only when thread 3 encounters it as part of an evaluation point:
- if ($tid == 3) $stop
Viewing and Modifying Thread Data
- Most of the basics of viewing and modifying data as covered in Part I hold true for threads.
- Beyond the basics, TotalView allows you to go a bit further with threads. You can display/modify "Laminated" variables and on some platforms you can display Thread Object data.
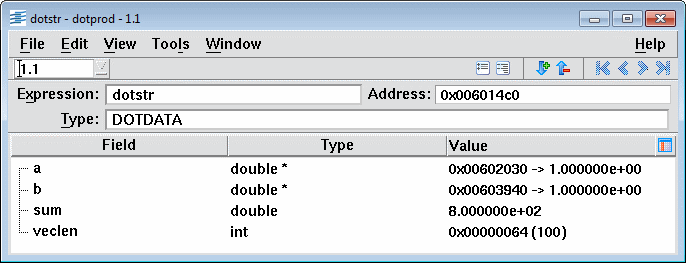
Laminated Variables
- Often times in a parallel program, the same variable will have multiple instances across threads and/or processes. In such cases, it is frequently desirable to view all occurrences simultaneously.
- TotalView provides a way for you to do this by "laminating" the variable. Laminating a variable means to display all occurrences simultaneously in a Variable Window.
- Laminated variables can include scalars, arrays, structures and pointers.
- TotalView also enables you to edit laminated variables - either collectively (same value applies to all instances) or individually.
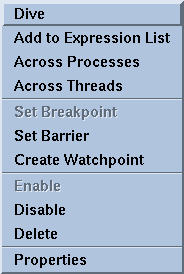
- Method 1: Right click on the variable and select "Across Threads" from the pop-up menu. A new Variable Window will appear showing the laminated variable (example below).
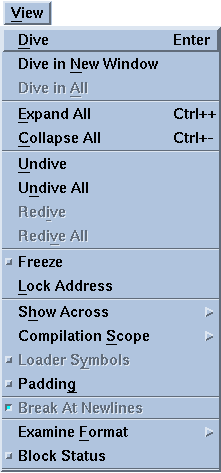
- Method 2: Dive on the variable so that it appears in a new Variable Window. Then:
- PATH: Variable Window > View Menu > Show Across > Thread
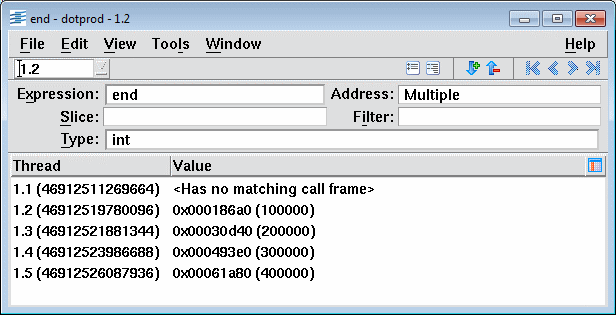
- Example of a laminated variable. Note that when laminating a variable, not all threads may be at a point in the program yet where the variable has a value. In such cases, the "Has no matching call frame" message will appear.
- After laminating a variable, you can return to the non-laminated view by:
- PATH: Variable Window > View Menu > Show Across > None
In the Kernel
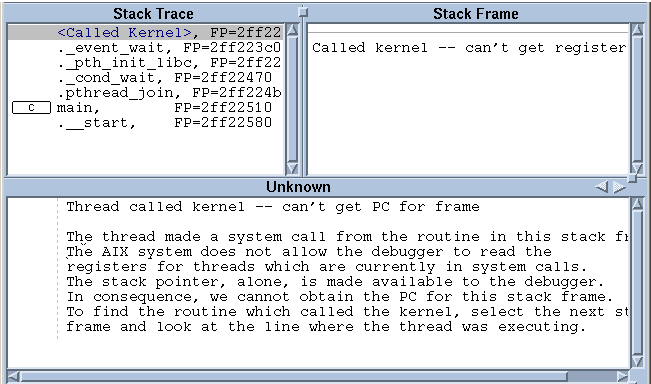
- The Process Window below shows what can happen when a thread calls a system kernel routine. The debugger may not have full access to thread state information when it executes within the kernel. There's not much you can do at this point, debugging wise.
Debugging OpenMP Codes
Overview
OpenMP Threads Model
- The OpenMP programming model is intrinsically based on threads.
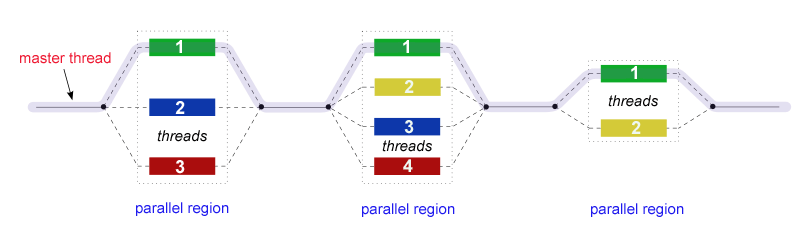
- All OpenMP programs begin with a single master thread (usually the original executable) that executes serially until a PARALLEL region in the program is encountered.
- When a PARALLEL region is encountered, the master thread forks a team of worker threads to execute that region in parallel.
- At the end of the PARALLEL region, the team joins/disbands and serial execution resumes by the master thread (see diagram below).
Supported Platforms
- TotalView provides support for OpenMP on most of its supported platforms, however there are differences between implementations.
- Please consult the TotalView documentation for important platform / compiler specific requirements and limitations.
Supported Features
- Source level debugging of the original OpenMP code
- Ability to place breakpoints throughout the OpenMP code, including lines that are executed in parallel.
- Visibility of worker threads
- Access to PRIVATE and SHARED variables in PARALLEL regions - for both master and worker threads.
- Access to THREADPRIVATE data on some platforms
Debugging OpenMP Programs
Just Like Threads (sorta)
- Because OpenMP is fundamentally thread-based, debugging OpenMP codes with TotalView is very similar to debugging threaded codes. In fact, Pthreads are often used by vendors to implement OpenMP.
- Most of what was covered previously in the Debugging Threaded Codes section holds true for OpenMP:
- Because of this, only the important differences between OpenMP and threaded debugging will be covered here.
Setting the Number of Threads
- Setting the number of threads to use during a debug session is handled exactly as specified by the OpenMP standard. In order of precedence (lowest to highest):
- Default: usually equal to the number of cpus on the machine
- OMP_NUM_THREADS environment variable at run time
- OMP_SET_NUM_THREADS routine within the source code
Code Transformation
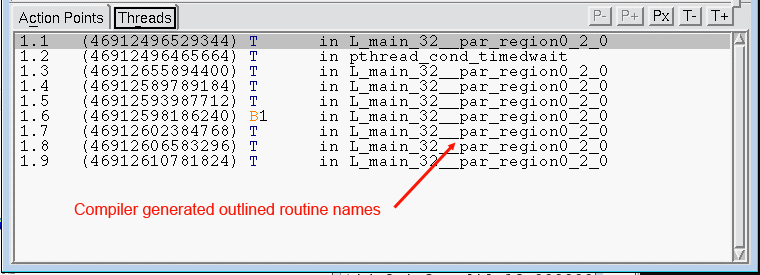
- Probably the most obvious difference between OpenMP codes and other threaded codes is the compiler's creation of outlined routines.
- Outlined routines are created when the compiler replicates the body of a PARALLEL region into a new, compiler created routine. This process is called outlining because it is the inverse of inlining a subroutine into its call site.
- In place of the parallel region, the compiler inserts a call to a run-time library routine. As the master thread creates worker threads, it dispatches them to the outlined routine, and then actually calls the outlined routine itself.
- Outlined Routine Names: These vary by compiler/platform. An example from the Intel Linux C compiler is shown below:
Master Thread vs. Worker Threads
- Thread Identifiers:
- In TotalView, the OpenMP master thread always has a thread id of 1, and the worker threads greater than 1.
- They do NOT match the actual OpenMP thread number. For example, in OpenMP, the master thread's id is zero.
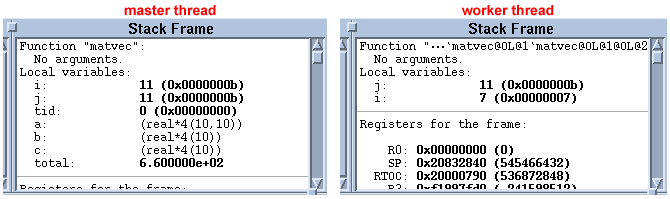
- Depending upon the platform/compiler, the master thread may look different than the worker threads. The most important difference is how shared variables are displayed in the Stack Frame.
- Case 1 - Different: Only the master thread displays a program's shared variables. Worker threads are limited to displaying their private variables. This is the case when using the IBM compilers on BG/Q systems at LC. The master/worker Stack Frames below demonstrate this:
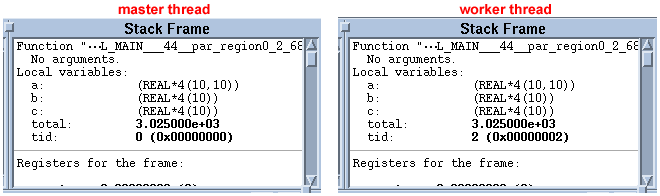
- Case 2 - Same: Both master and worker threads are enabled to display a program's shared variables. They also display their private variables identically. This is the case when using Intel compilers on Linux systems at LC. The master/worker Stack Frames below demonstrate this.
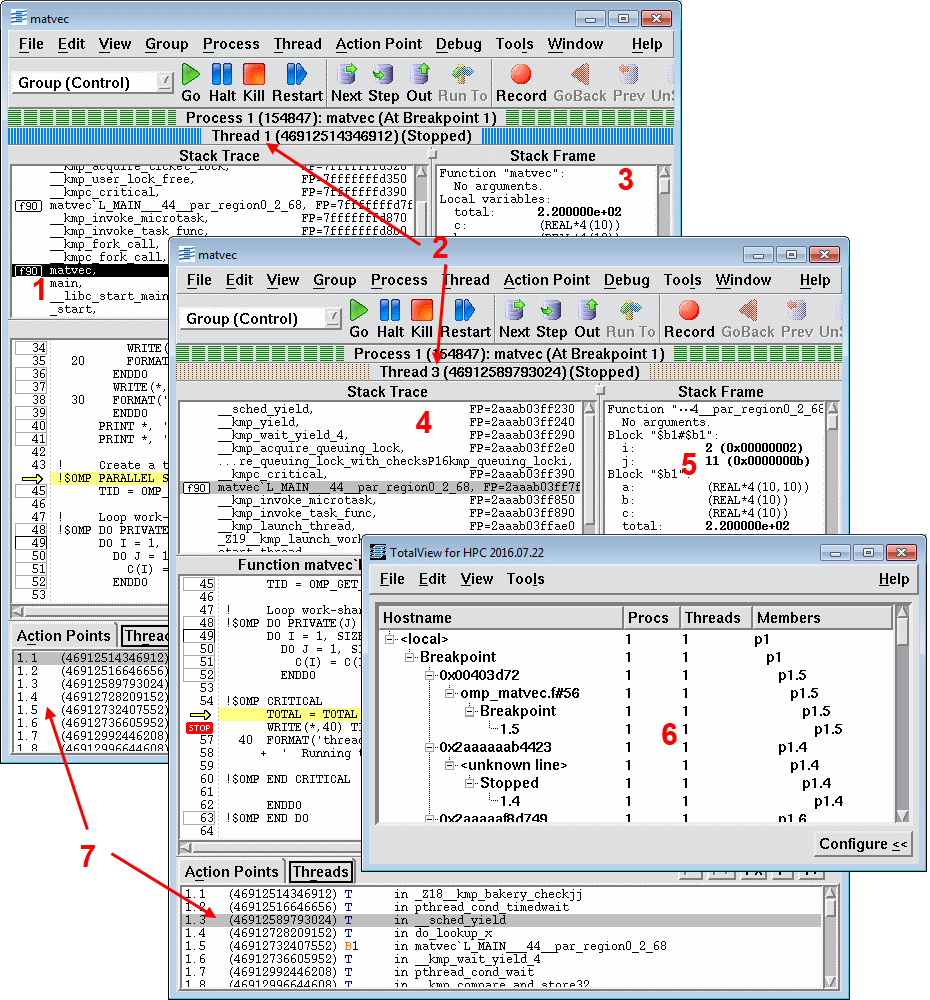
Example OpenMP Session
- Master thread Stack Trace Pane showing original routine (highlighted) and the outlined routine above it
- Process/thread status bars differentiating threads
- Master thread Stack Frame Pane showing shared variables
- Worker thread Stack Trace Pane showing outlined routine.
- Worker thread Stack Frame Pane, in this case showing both private and shared variables
- Root Window showing all threads
- Threads Pane showing all threads plus selected thread
Execution Control
- Similar to threads as discussed previously.
- Stepping: you can not step into or out of a PARALLEL region. Instead, set a breakpoint within the parallel region and allow the process to run to it. From there you can single step within the parallel region.
- Asynchronous execution: single stepping or running one OpenMP thread while others are stopped can lead to unexpected program behavior (like hanging). CTRL-C may be able to be used to cancel the command that caused the hang.
Viewing and Modifying Data
- Viewing and displaying data behaves the same as for other threaded codes.
- As with other threaded codes, TotalView supports laminated variable displays for OpenMP also.
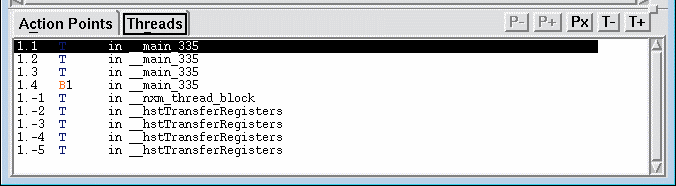
Manager Threads
- Some platforms create additional threads for management purposes. Manager threads are given a negative thread id by TotalView.
- Manager threads should be ignored - do not try to debug them.
- Example showing manager threads in addition to OpenMP threads. The Process Window Threads Pane is shown.
Debugging MPI Codes
Overview
Multi-Process
- MPI programs behave as multiple processes within TotalView:
- Each MPI task comprises its own process.
- Every MPI task can run/stop and be debugged independently from other MPI tasks.
- MPI tasks can also be debugged collectively with related MPI tasks.
- As discussed in the Process/Thread Groups section , TotalView assigns processes into Share groups. In most cases, if all of your MPI tasks are running the same executable, (SPMD Model) they will all be in the same Share Group. Otherwise, MPI tasks running different executables (MPMD Model) will be in different Share groups.
- Most of the usual TotalView commands/features behave as would be expected with an individual MPI process. However, there are several important considerations and unique features associated with multi-process MPI debugging.
- MPI codes can be combined with threads and OpenMP (covered later) to create multi-threaded, multi-process programs.
Supported Platforms
- TotalView supports the native vendor MPI implementation and also the MPICH implementation. For platform specifics, see the TotalView User Guide.
Starting an MPI Debug Session
Just a Little Bit Different
- MPI manager process:
- Typically, MPI programs run under a "manager" process, such as poe, srun, prun, mpirun, dmpirun, etc.
- Because of this, you must start TotalView with the manager process, NOT the name of your MPI executable.
- Automatic process acquisition:
- Most MPI programs run on multiple hosts, however when you start TotalView it is on a single host.
- TotalView is able to automatically acquire all parallel processes at start-up.
- TotalView is also able to attach to an already running parallel program and automatically acquire all of its processes.
- This is accomplished by TotalView starting a tvdsvr process on each machine where it must acquire and manage a parallel task.
- Configuration Details:
- There are several issues involved in configuring TotalView to run multi-process jobs, most of which should normally be transparent to the user. See the TotalView User Guide for details if problems arise with starting MPI sessions under TotalView.
Example
- Start TotalView with the parallel task manager process. Note that the order of arguments and executables is important, and differs between platforms.
Examples:
| MVAPICH Linux under SLURM |
totalview srun -a -n 16 -p pdebug myprog |
|---|---|
| IBM AIX | totalview poe -a myprog -procs 4 -rmpool 0 |
| SGI | totalview mpirun -a myprog -np 16 |
| Sun | totalview mprun -a myprog -np 16 |
| MPICH | mpirun -np 16 -tv myprog |
- The Root Window and Process Window will appear as usual, however it will be the manager process that will be loaded, not your program. Start the manager process by typing g in the Process Window or by:
- PATH: Process Window > Process Menu > Go
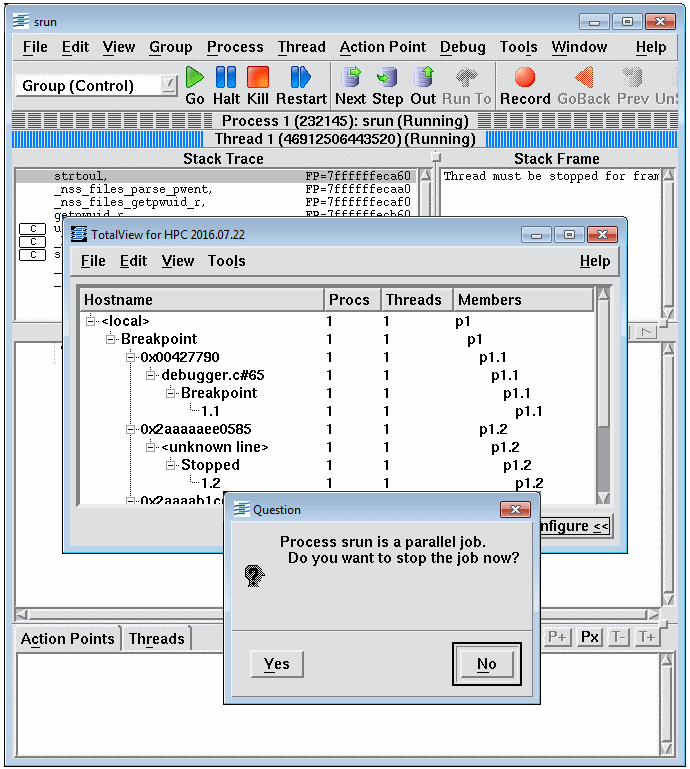
- A dialog window will then appear notifying you that it is a parallel job and asking whether or not you wish to stop the job now. Click on Yes (see below). Note: if you click on No the job will begin to immediately execute before you have a chance to set breakpoints, etc.
- TotalView will then acquire the MPI tasks which are running under the manager process. When this is done, the Process Window will default to displaying the state information and source for MPI task 0. You are now ready to begin debugging your program.
Selecting an MPI Process
By Diving
- After selecting a process in the Root Window, you can dive on it by three different methods:
-
- Double left clicking
- Right clicking and then selecting Dive from the pop-up menu
- Selecting Dive from the Root Window's View Menu.
- That process's information will then be displayed in the current Process Window.
- To force a new Process Window for a process, use Dive In New Window from the View Menu or right click pop-up menu. Multiple Process Windows, one for each MPI task, can be created this way.
By Process Navigation Buttons
- Use the process navigation control buttons (below) located in the bottom right corner of the Process Window.
- "Cycle-through" the processes until the desired task's information fills the Process Window.
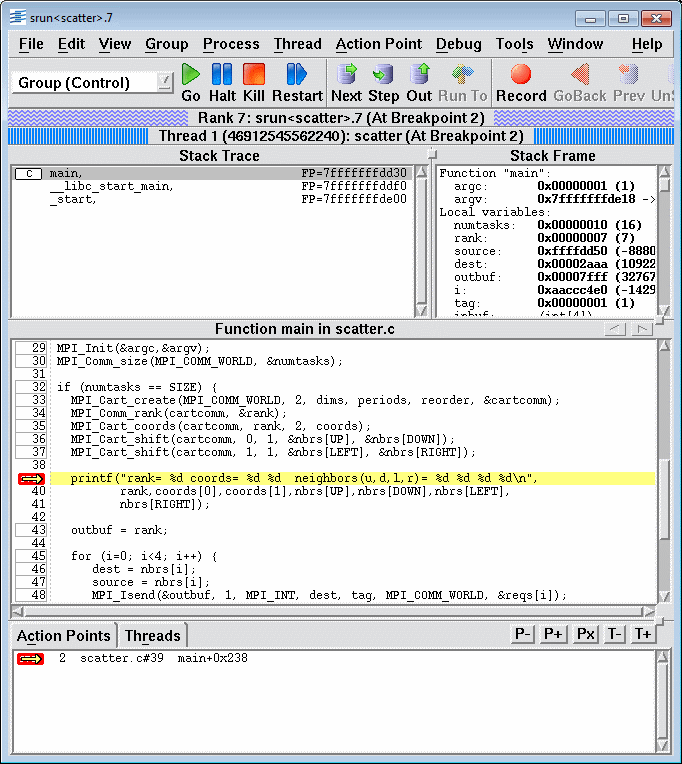
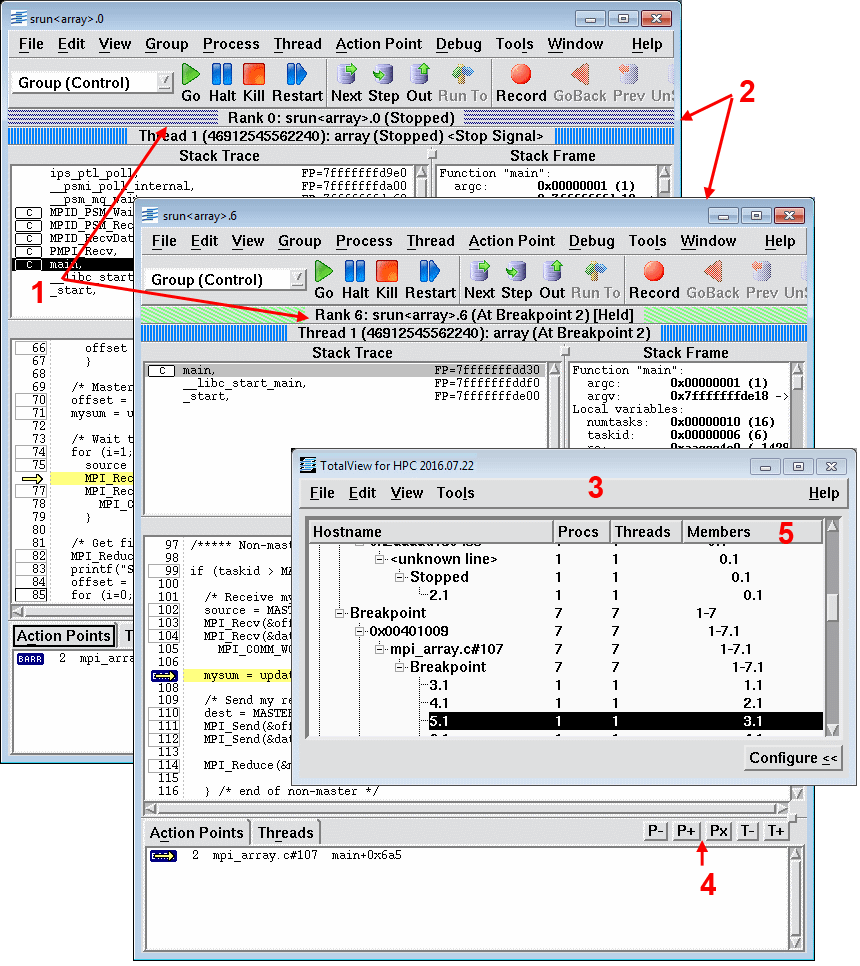
Example
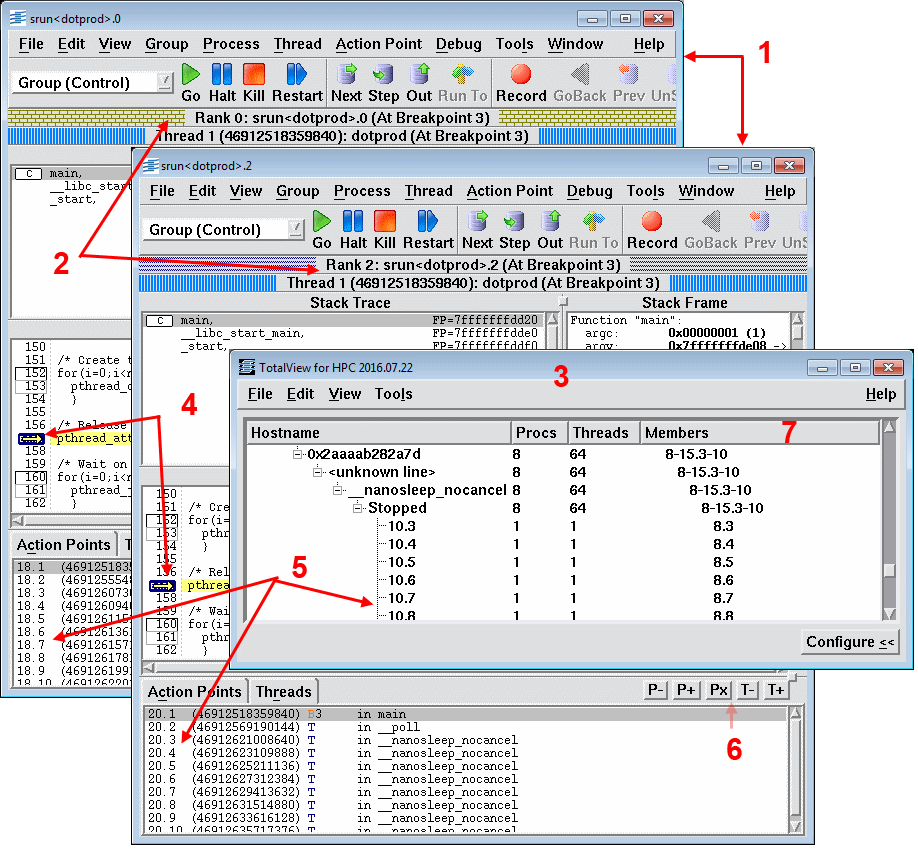
- The example below demonstrates an MPI debug session. Some items of interest:
- Process Windows differentiated by pane trim and status bars.
- Multiple process windows - one for MPI task 0 and one for MPI task 3
- Root Window MPI task information for multiple MPI processes
- Navigation buttons enabled for processes
- MPI rank/thread identifiers under Members column
Controlling MPI Process Execution
- MPI task execution can be controlled at the individual process level, or collectively as a "group".
- TotalView provides two different levels of control for MPI process execution commands. The table below describes these.
| Scope | Description |
|---|---|
| Group | Execution commands apply to all MPI processes PATH: Process Window > Group Menu |
| Process | Applies to a single MPI process PATH: Process Window > Process Menu |
- Note that command scope is constrained to the selected TotalView P/T group (Control, Share, Workers, Lockstep) as discussed in the Process/Thread Groups section.
Starting and Stopping Processes
- As seen previously, TotalView will ask you whether or not you wish to stop your parallel job before it starts to execute. Saying "Yes" to this allows you to set breakpoints and do other things before your tasks actually start running.
- Starting your program and controlling its execution is then up to you, using either the Group Menu or the Process Menu from the Process Window.
- If you use accelerator keys to control execution, be sure to type the right key! It is a fairly common accident to use a process level command instead of group level command (and vice-versa). For example, typing g instead of G.
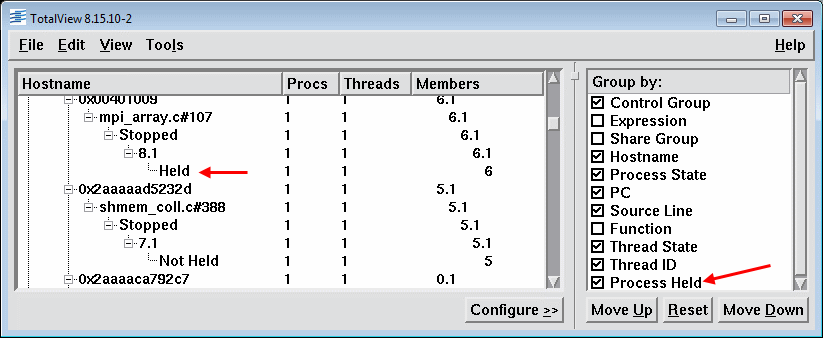
Holding and Releasing Processes
- When a process is held, it is unresponsive to commands that would cause it to run, such as Go, Step, Next...
- Processes are automatically placed in a hold state when they encounter a barrier point. They can also be placed on hold manually by either method below, depending upon whether you want to hold all processes or just one:
- PATH: Process Window > Group Menu > Hold
- PATH: Process Window > Process Menu > Hold
- Held processes will display an Held state in the Root Window (below).
- Processes are released automatically whenever all processes have reached the same barrier point. They can also be released manually:
- PATH: Process Window > Group Menu > Release
- PATH: Process Window > Process Menu > Hold (toggle)
- Note that releasing a process does not make it "Go". It only allows it to respond again to run type commands.
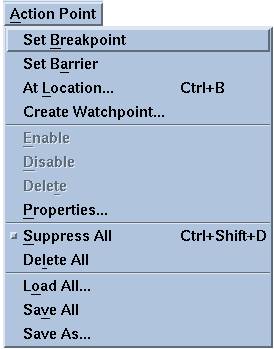
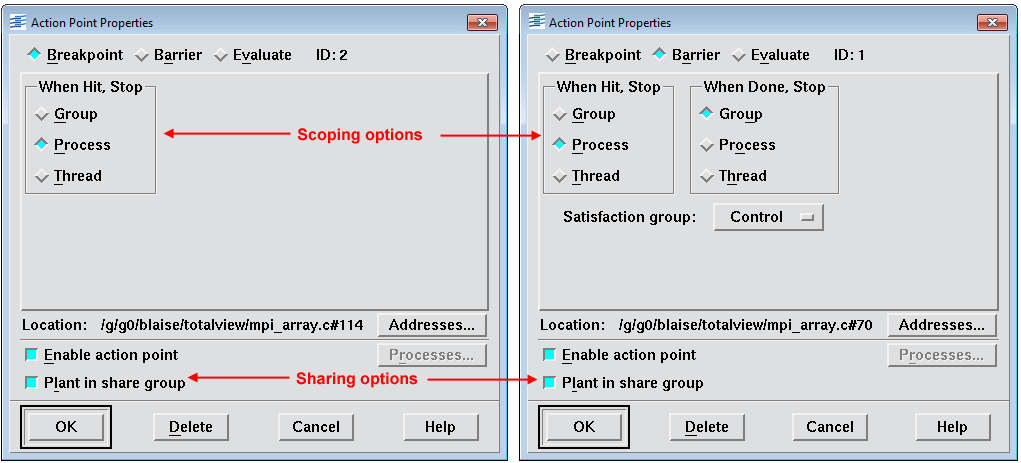
Breakpoints and Barrier Points
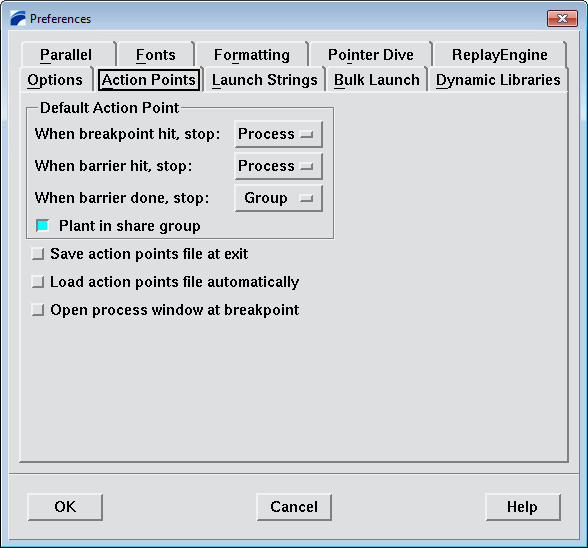
- TotalView provides two options that control the behavior of breakpoints and barrier points:
- Sharing: Should the action point be "planted" in all processes of the group? Planting means that if you set the action point in one MPI task, TotalView will automatically replicate it in all MPI tasks. The default behavior for both breakpoints and barrier points is to automatically plant the action point in all processes.
- Scoping: Should the action point affect the group, the process or the thread(s)? The default behavior for both breakpoints and barrier points is to stop the process.
- Individual breakpoint and barrier point behavior can be customized via the Action Point Properties Dialog Box. To open this window, first select a source line with a breakpoint or barrier point. Then do either:
- Dive (right-mouse) click on the source code line and then select Properties from the resulting pop-up menu.
- PATH: Process Window > Action Point Menu > Properties
- Dive (right-mouse) click on the source code line and then select Properties from the resulting pop-up menu.
- Action Point Properties Dialog Boxes for both breakpoints and barrier points are shown below.
- You can also customize the default behavior for all breakpoints and barrier points:
- Use either:
- PATH: Root Window > File Menu > Preferences
- PATH: Process Window > File Menu > Preferences
- Select the Action Points Page and then choose your desired options.
- See the previous discussion on Action Points for more information on using Breakpoints and Barrier Points.
Warning About Single Process Commands
- If you use a process-level single stepping command in a multi-process MPI program, it is possible that TotalView will appear to hang. This happens when you step over a statement that can not complete because the process it depends upon is stopped (as in communications).
- Using CTRL-C may be able to be used to cancel the step command that caused the hang.
Viewing and Modifying Multi-process Data
- Most of the basics of the viewing and modifying data as covered in Part I hold true for multi-process MPI programs.
Laminated Variables
- Often times in a parallel program, the same variable will have multiple instances across threads and/or processes. In such cases, it is frequently desirable to view all occurrences simultaneously.
- TotalView provides a way for you to this by "laminating" the variable. Laminating a variable means to display all occurrences simultaneously in a Variable Window.
- Laminated variables can include scalars, arrays, structures and pointers.
- TotalView also enables you to edit laminated variables - either collectively (same value applies to all instances) or individually.
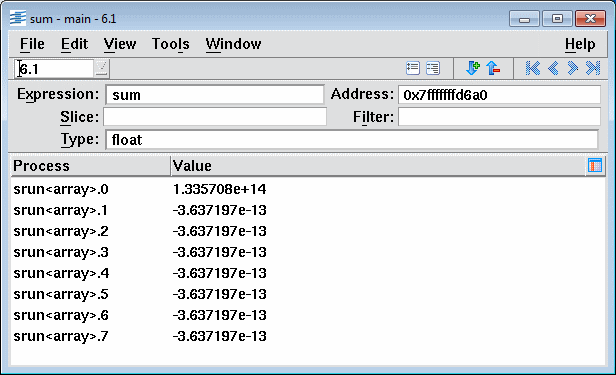
- Method 1: Right click on the variable and select "Across Processes" from the pop-up menu. A new Variable Window will appear showing the laminated variable (examples below).
- Method 2:Dive on the variable so that it appears in a new Variable Window. Then:
- PATH: Variable Window > View Menu > Show Across > Process
- Two examples are shown below - the first is a laminated scalar variable and the second is a laminated array variable.

- The laminated variable view is a toggle display. After laminating a variable, you can return to the non-laminated view by:
- PATH: Variable Window > View Menu > Show Across > None
Displaying Message Queue State
- TotalView allows you to examine the run-time state of your MPI program's message passing. This can be helpful when debugging deadlocked programs.
- To view the message queue state for a selected MPI process, first stop execution, then:
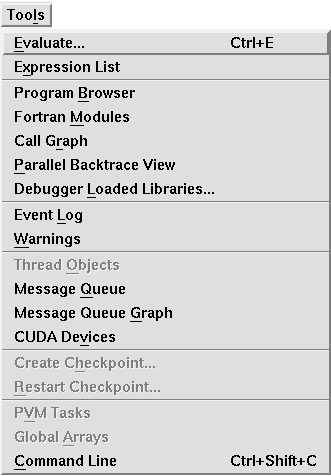
- PATH: Process Window > Tools Menu > Message Queue
- The Message Queue Window will then appear - an example is shown below.

Types of Messages Displayed
- Pending receives - non-blocking and blocking.
- Pending sends - non-blocking and blocking.
- Unexpected messages - messages sent to this process which do not yet have a matching receive operation.
- Normally completed messages are not saved or viewable.
Actions
- Because the Message Queue Window information is actually derived from the MPI library, the data is view only - no modification is permitted.
- Diving on the "Source" field will refocus the current Process Window with that task's information or else open a new window for the source task.
- Diving on the "Buffer" field will allow you to see the message's contents in a Variable Window. This data can then be treated as normal data - modify values, type, laminate, etc.
Message Queue Graph
- TotalView also provides a graphical representation of your program's message queue state at a given instant.
- To view your program's message queue state graph, first stop execution. Then select:
- PATH: Process Window > Tools Menu > Message Queue Graph
- The Message Queue Graph Window will then appear - an example is shown below.

- Clicking on the "Options" tab will open the Options dialog box, shown below.
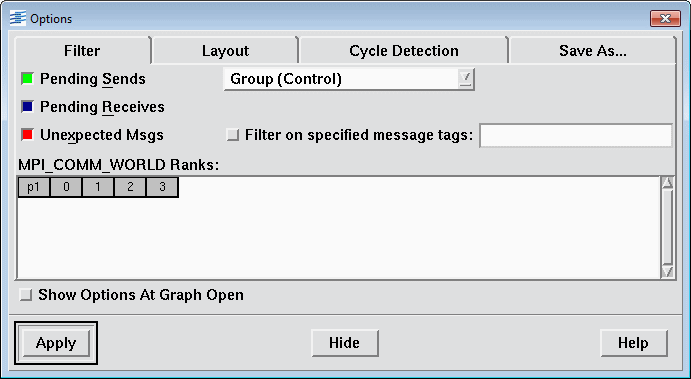
- Some usage notes:
- Processes are indicated by yellow boxes in the graph, and as blocks in the communicator box on the right side. Task ranks are the numbers that appear in both locations.
- Select/deselect types of messages to display then click on Update button
- Red = Unexpected, Blue = Pending Receive, Green = Pending Send
- Numbers next to arrow points indicate the message tag
- Diving on a box causes that task's information to appear in a Process Window
- Diving on an arc/arrow point will open the detailed Message Queue Window for that task
- Boxes and arcs can be repositioned by dragging them with the mouse, however clicking on the Update button will reset the view back to the original object positions
- See the built-in Help for additional information
Notes
- The information displayed in the Message Queue Window may vary slightly between platforms and MPI implementations.
- There are several important platform and implementation prerequisites and limitations. See the TotalView documentation for details.
Debugging Hybrid Codes
Overview
What are "Hybrid" Codes?
- Hybrid codes are programs that use more than one type of parallelism. This programming model is becoming increasingly popular as systems comprised of clusters of SMPs are now very common.
- Probably the most frequently used type of hybrid programming is MPI with Pthreads or MPI with OpenMP. One scenario (there are certainly others):
- A large problem is decomposed for execution on a cluster of SMP machines.
- A single MPI process is started on each SMP machine.
- Each MPI process divides up its work between multiple threads.
- Threads execute on the CPUs of a single SMP machine, using shared memory parallelism.
- When data needs to be exchanged between machines, one of the threads uses MPI to communicate with the MPI tasks on other machines.
Nothing New (Just More of It)
- TotalView includes no new "features" or special functions to handle hybrid codes. There is nothing new to learn.
- Everything that applies to MPI, threads and OpenMP holds true essentially unaltered for hybrid codes.
- The real challenge is managing and understanding the increased complexity that arises from combining two different types of parallelism.
Supported Platforms
- Basically, whatever is supported / restricted for MPI, threads and OpenMP on any given platform will hold true for hybrid programs on that platform.
- See the TotalView documentation for details.
Debugging Hybrid Programs
Starting a Hybrid Code Debug Session
- If your hybrid code is a combination of MPI with either OpenMP or Pthreads, then you will most likely start your debug session as you would for MPI. See Starting an MPI Debug Session for examples.
- OpenMP programs will typically follow the usual convention for setting the number of threads as defined by the OpenMP standard: In order of precedence (lowest to highest):
- Default: usually equal to the number of cpus on the machine
- OMP_NUM_THREADS environment variable at run time
- OMP_SET_NUM_THREADS routine within the source code
Tying it All Together
- Debugging hybrid programs combines everything previously discussed in Debugging Threaded Codes, Debugging MPI Codes and Debugging OpenMP Codes.
- MPI tasks behave individually as processes and collectively as a group
- Threads exist within an MPI process
- Execution control can be specified at the thread, process or group level within the selected P/T group
- Action points can be shared across a group or remain local to a process
- Every thread and process can have its own Process Window here.
- Selection and navigation between threads and processes works as usual
Example
- An example debug session with a hybrid MPI / Pthreads program is shown below. Some details of interest:
- Each MPI task / thread can have its own Process Window - two are shown here
- Processes and threads are differentiated by pane trim and status bars
- Root Window showing MPI processes and associated threads.
- Process barrier point in effect across multiple processes
- MPI process (not rank) identifiers and thread identifiers are the same as usual
- Both process and thread navigation buttons are active
- MPI rank/thread identifiers under Members column
Batch System Debugging
Why Debug in Batch?
- LC's pdebug queues are intended to facilitate short, small, interactive sessions, including debugging.
- However, the number of nodes available in the typical pdebug queue is small, making it impossible to debug most "real size" parallel applications.
- It is common for large parallel problems to encounter bugs that are not seen with small interactive parallel runs. Debugging the application while it is running in the larger batch system may be the only means of diagnosing and fixing the problem.
- Fortunately, at LC, it is relatively easy to conduct a debug session on batch jobs.
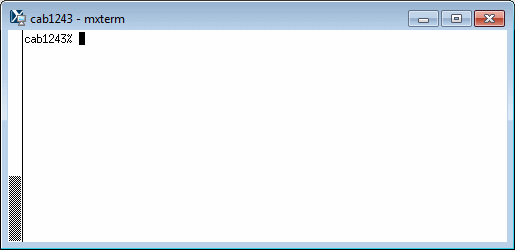
Using LC's mxterm / sxterm Utilities
- Most of LC's production clusters provide two simple utilities called mxterm and sxterm, which makes it easy for users to initiate a batch job debugging session. These utilities are equivalent:
- mxterm uses Moab syntax
- sxterm uses Slurm syntax
- Syntax:
- mxterm #nodes #tasks #minutes msub_argument_list
- sxterm #nodes #tasks #minutes sbatch_argument_list
- Examples:
- Get 8 nodes with 128 tasks for 4 hours:
- mxterm 8 128 240
- sxterm 8 128 240
- Similar, but showing use of Moab/Slurm options:
- mxterm 8 128 30 -l qos=standby -q pdebug
- sxterm 8 128 30 --qos=standby -p pdebug
- Get 8 nodes with 128 tasks for 4 hours:
- After successfully issuing the command, the utility will submit a batch job for you. You'll then see the usual batch job identifier displayed back to you. For example:
% mxterm 16 256 60

330648
- At this point, your batch debug session is actually queued as a batch job, and must wait in the job queue until its time to run occurs. You can use all of the usual job monitoring commands to track its progress.
- Assuming that you have your X11 environment setup correctly on your desktop, you will eventually see an xterm window appear on your screen. This means that your batch partition has been acquired and you can now run commands in it just as though you were having an interactive session.
- Within the new xterm window, you can now start totalview with your executable, just as you would an interactive session. For example:
totalview srun -a -n 256 myprog
Attaching to a Running Batch Job
- If you have a batch job that is already running, you can start TotalView on one of the cluster's login nodes and then attach to it.
- Login to the cluster where your job is running
- Set up your X11 display environment
- Determine where your job is running by using a command such as mjstat or squeue. For example:
cab669% mjstat | grep joeuser
331894   joeuser        2 pbatch    R            10:15  cab430

cab669% squeue | grep user2
329921    pbatch    pmin0   user2   R    9:39:59      4 cab[756,816-817,863]
- Note that for multi-node, parallel MPI jobs
- mjstat only shows the node where the MPI manager task (srun) is running
- squeue will show all nodes, but the first node in the list is where the MPI manager process is running.
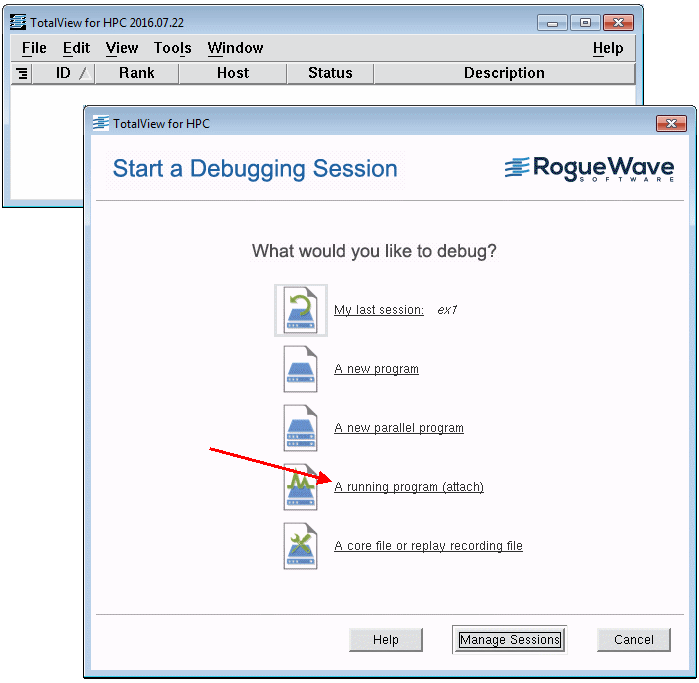
- Start TotalView alone: totalview
- When the Session Manager dialog box appears (below), select A running program (attach):
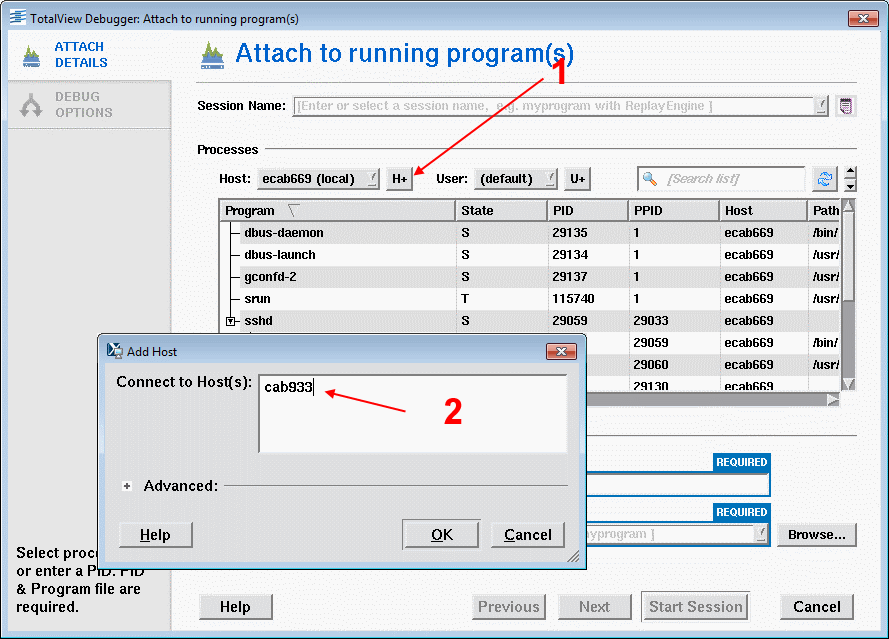
- An Attach to running program(s) dialog box will then appear (below):
- Click on the H+ button to add a host
- An Add Host dialog box will appear. Enter the name of the node obtained from the mjstat or squeue command above. Then click OK.
- The contents of the Attach to running program(s) dialog box will change after a connection is made to the specified node (below):
- Click on the name of your executable in the process list. If it is an MPI job, click on the srun process.
- Click on the Start Session button.
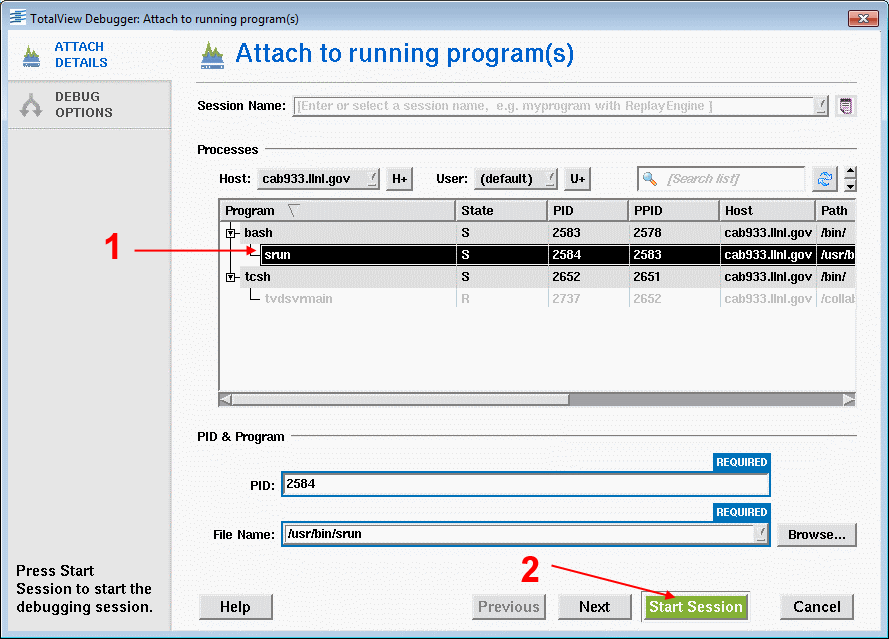
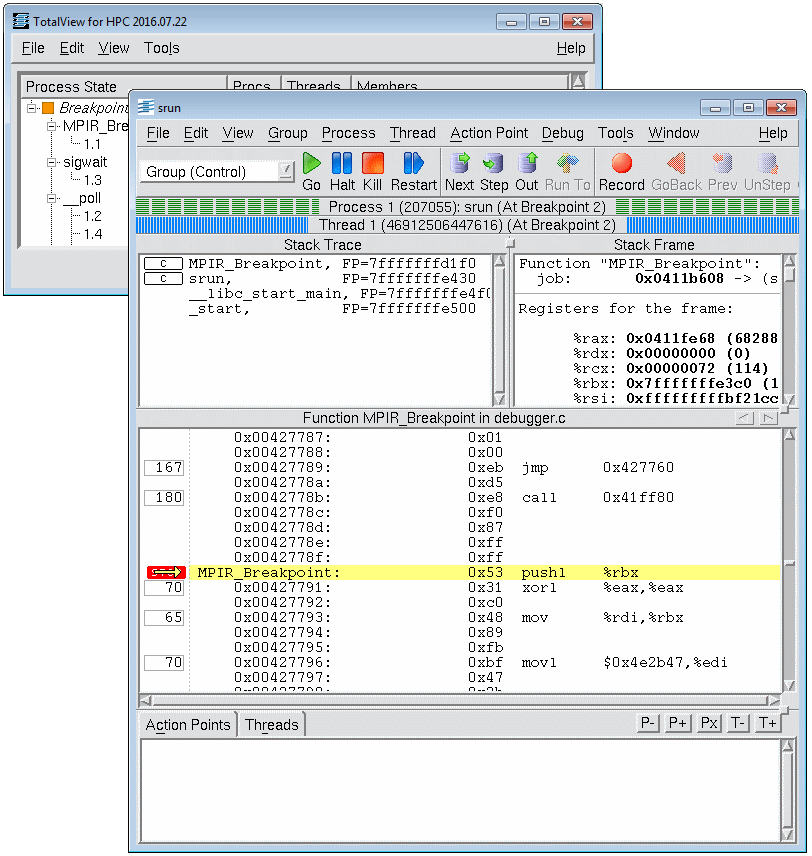
- A Process Window will then appear with the selected executable now attached to TotalView. If you are running an MPI job, it will be the manager task. You can now debug as usual.
Topics Not Covered
TotalView includes a number of other features and functions not covered in this tutorial. A partial list of these appears below. Please consult the TotalView Documentation for more information.
- Most of the CLI is not covered
- Setting up remote debugging sessions
- Most platform specific information
- Debugging PVM / DPVM applications
- Debugging MPICH applications
- Debugging SHMEM applications
- Debugging UPC applications
- Memory debugging
- Replay engine
- Operating system features
- Visualizer Details
This concludes TotalView Part 3. Where would you like to go now?
- Back to the top of Part 3
- Back to Part 1: The Very Basics
- Back to Part 2: Common Functions
References and More Information
The most useful documentation and reference material is from TotalView's vendor site. You can download this from the TotalView section of their website at Rogue Wave Software, Inc.
If you already have TotalView installed, the same documentation comes with the installation and is available from the install directory and by using TotalView's "Help" menu.