Intel Advisor is a prototyping tool that allows users to analyze their code and determine the costs and benefits of adding various threading models on Intel processors. It works on code written in C, C++, and Fortran, and can model parallelism using OpenMP, Intel Thread Building Blocks, and Intel Cilk Plus. Advisor can also provide guidance to help codes get better vectorization, which is becoming increasingly important with wide vector units in modern processors.
It is composed of two tools:
- Threading Advisor is a fast-track threading design and prototyping tool that lets you analyze, design, tune, and check threading design options without disrupting your normal development.
- Vectorization Advisor is a vectorization optimization tool that lets you identify high-impact, under-optimized loops, what is blocking vectorization, and where it is safe to force vectorization. It also provides code-specific how-can-I-fix-this-issue? recommendations.
Platforms and Locations
| Platform | Location | Notes |
|---|---|---|
|
Linux |
/usr/tce/packages/advisor | Multiple versions are available. Use module commands to view and load. |
| CORAL ppc64le |
N/A | Not available on CORAL systems |
Quick Start
First, use the appropriate module commands to view the available Advisor software module packages and load the desired package. For example:
% module avail advisor

---------------------------------- /usr/tce/modulefiles/Core -----------------------------------
   advisor/2022.1.0

  Where:
   L:  Module is loaded
   D:  Default Module

Use "module spider" to find all possible modules.
Use "module keyword key1 key2 ..." to search for all possible modules matching any of the
"keys".

% module load  advisor
Advisor includes both a graphical user interface (GUI) and a command line (CL) interface that can be accessed with the advixe-gui and advixe-cl commands, respectively. When running the GUI, begin by creating a new project, entering the executable path and arguments, and setting other options. Once the Advisor project is created, run through the threading and/or vectorization workflows.
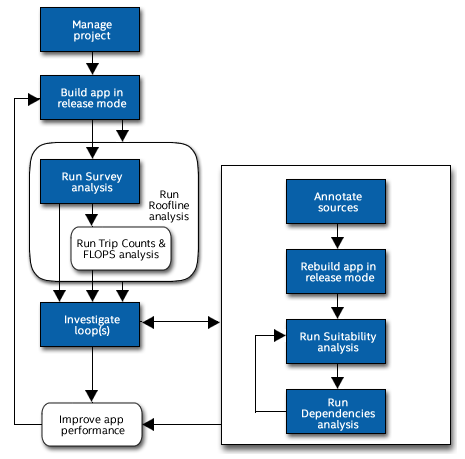
The Threading Workflow consists of these steps:
- Survey report: Shows the loops and functions where your application spends the most time. Use this information to discover candidates for parallelization with threads.
- Trip counts analysis: Shows the minimum, maximum, and median number of times a loop body will execute, as well as the number of times a loop is invoked. Use this information to make better decisions about your threading strategy for particular loops.
- Roofline chart: Helps visualize actual performance against hardware-imposed performance ceilings, as well as determine the main limiting factor (memory bandwidth or compute capacity), thereby providing an ideal roadmap of potential optimization steps.
- Annotations: Insert to mark places in your application that are good candidates for later replacement with parallel framework code that enables threading parallel execution. Annotations are subroutine calls or macros (depending on the programming language) that can be processed by your current compiler but do not change the computations of your application.
- Suitability report: Predicts the maximum speed-up of your application based on the inserted annotations and a variety of what-if modeling parameters with which you can experiment. Use this information to choose the best candidates for parallelization with threads.
- Dependencies report: Predicts parallel data sharing problems based on the inserted annotations. Use this information to fix the data sharing problems if the predicted maximum speed-up benefit justifies the effort.
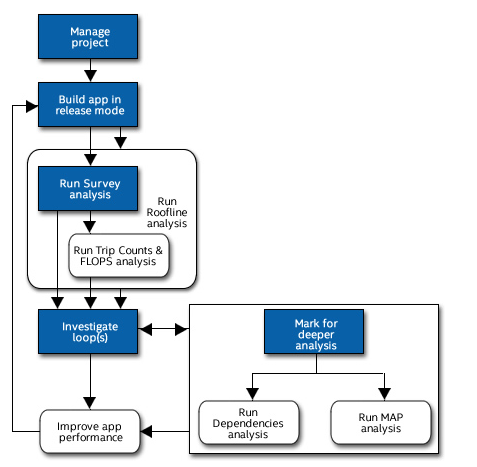
The Vectorization Workflow consists of these steps:
- Survey report: Offers integrated compiler report data and performance data all in one place. Use it to help identify: Where vectorization, or parallelization with threads, will pay off the most
- Trip counts and FLOP analysis: Dynamically identifies the number of times loops are invoked and execute (sometimes called call count/loop count and iteration count respectively); and measures the number of floating-point and integer operations, and memory traffic. Use to make better decisions about your vectorization strategy for particular loops, as well as optimize already-parallel loops.
- Roofline chart: Helps visualize actual performance against hardware-imposed performance ceilings, as well as determine the main limiting factor (memory bandwidth or compute capacity), thereby providing an ideal roadmap of potential optimization steps.
- Dependencies report: For safety purposes, the compiler is often conservative when assuming data dependencies. Use a Dependencies-focused Refinement Report to check for real data dependencies in loops the compiler did not vectorize because of assumed dependencies. If real dependencies are detected, the analysis can provide additional details to help resolve the dependencies. Your objective: Identify and better characterize real data dependencies that could make forced vectorization unsafe.
- Memory Access Patterns (MAP) report: Use a MAP-focused Refinement Report to check for various memory issues, such as non-contiguous memory accesses and unit stride vs. non-unit stride accesses. Your objective: Eliminate issues that could lead to significant vector code execution slowdown or block automatic vectorization by the compiler.
Documentation and References
The primary sources for product documentation are available on Intel's website, though some searching may be required. For convenience, getting started documentation is available as part of the LC Advisor installation, viewable from an LC cluster using the FireFox or Konqueror web browsers.
| Intel Advisor main web page: Intel Advisor User Guide: |
software.intel.com/en-us/advisor software.intel.com/en-us/advisor-user-guide |
| LC installation documentation: | /usr/tce/packages/advisor/default/documentation/en/C++/welcomepage/get_started.htm |


